- Title
-
Dynamic filopodia are required for chemokine-dependent intracellular polarization during guided cell migration in vivo
- Authors
- Meyen, D., Tarbashevich, K., Banisch, T.U., Wittwer, C., Reichman-Fried, M., Maugis, B., Grimaldi, C., Messerschmidt, E.M., Raz, E.
- Source
- Full text @ Elife
|
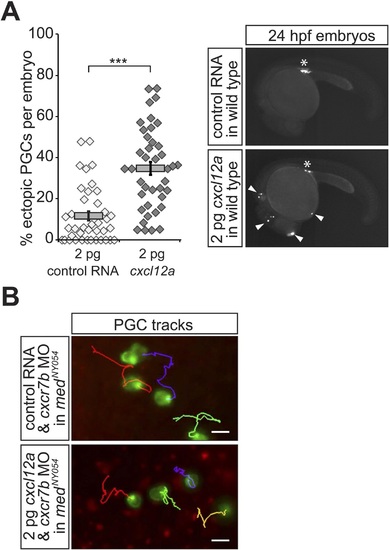
Properties of PGCs migrating in embryos expressing a low concentration of uniform Cxcl12a. (A) Injection of 2 pg of Cxcl12a-encoding RNA into embryos results in an increase in the proportion of the ectopic PGCs per embryo at 24 hpf. Representative embryos are shown on the right. An asterisk labels the site where the gonad develops; ectopic PGCs are labelled with arrowheads. 39 control and 40 embryos expressing 2 pg Cxcl12a were analysed. (B) Migration tracks of PGCs in medNY054 homozygous embryos knocked down for Cxcr7b and injected with 2 pg control mRNA (upper panel) or 2 pg cxcl12a mRNA (lower panel). Tracks represent 58 min of PGC migration in 7 hpf embryos acquired at a 2 min interval (Video 4). |
|
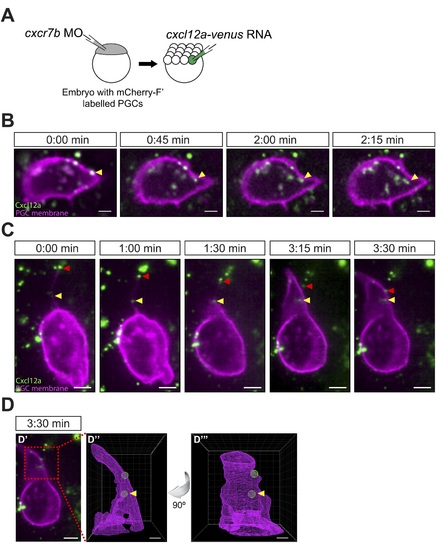
Cxcl12a internalization and interaction with filopodia. (A) Schematic experimental setup. Cxcr7b function was knocked down in embryos, in which PGCs express mCherry on their membrane. At 16-cell stage, these embryos were injected with cxcl12a-venus RNA directed into a corner cell for a mosaic expression of the chemokine. (B) Cxcl12a (green) is bound to the PGC membrane (magenta) and internalizes into the cell. Snapshots from Video 8, showing an optical section of a PGC (a Z-projection of two 1-Ám-slices). An arrowhead points at an internalizing Cxcl12a spot. Scale bar is 5 Ám. (C) Snapshots from Video 9, showing an optical section of a PGC (a Z-projection of 4 1-Ám-slices) with Cxcl12a (green) interaction seen on the filopodium (magenta). The red arrowhead indicates a Cxcl12a spot bound to the tip of the retracting filopodium and the yellow arrowhead points at Cxcl12a, which is bound to the filopodium closer to the cell body and is then engulfed by the cell (1:30?3:30 min). Scale bar is 5 Ám. (D) PGC from panel C at 3:30 min (D′) where the area magnified in D3 and D4 is delineated in a red box. (D′′ and D′′′) A 3D wire presentation of the magnified cell surface area (magenta) and the relevant Cxcl12 foci (green). (D′′) A 3D image orientated as the original panel in C and (D′′′) is horizontally rotated (90░ clockwise) to visualize internalization of Cxcl12a. Scale bar is 2 Ám. |
|
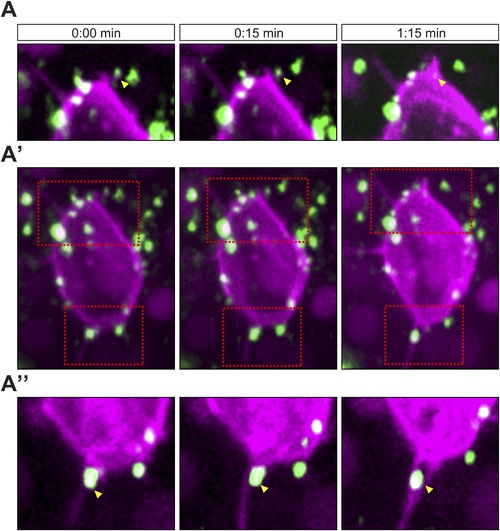
Cscl12a interaction with filopodia at the front and back of the cell (A?A′′) Cxcl12a (Venus-tagged, green) interacts with filopodia of a PGC (mCherry-F, magenta). (A′) An optical section of a PGC (a Z-projection of 4 1-Ám-slices) with Cxcl12a (green) interaction with filopodia (magenta) observed over 1:15 min. (A and A′′) Magnified insets marked in A′ as red squares. The yellow arrowheads point at Cxcl12a spots along filopodia. |
|
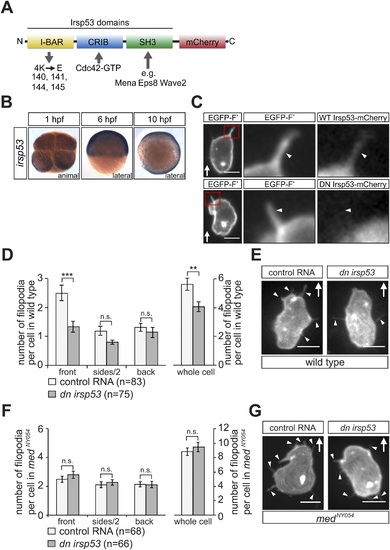
irsp53 RNA expression, Irsp53 protein localization and the role of the protein in filopodia formation. (A) Schematic structure of the Irsp53 protein domains. The position of the mCherry fluorophore fusion at the C-terminus of the protein is presented, proteins interacting with the SH3 and CRIB domains are indicated and the mutations introduced into the I-BAR domain to generate the dominant-negative (DN) Irsp53 version are marked. (B) Ubiquitous expression of the irsp53 RNA in 1, 6 and 10-hpf embryos. (C) A single plane of PGCs expressing EGFP-F′ and an Irsp53-mCherry protein fusion showing localization of Irsp53 to filopodia (upper panel), while the dominant-negative Irsp53 protein is not found in the filopodia (lower panel). Rectangles delineate the area of magnification shown in the right panels. (D) Reduction of filopodia number at the cell front in PGCs in wild type embryos expressing the DN Irsp53 protein (dark bars) relative to control PGCs (light bars). ?n? indicates the number of cells analysed. (E) Examples of a control (left) and a dn irsp53-expressing (right) PGCs in wild type embryos. (F) Expression of dn irsp53 in PGCs of medNY054 homozygous embryos shows no effect on filopodia number and distribution around the cell perimeter (dark bars) as compared with control PGCs (light bars). (G) Examples of a control (left) and a dn irsp53-expressing (right) PGCs in medNY054 homozygous embryos. ?n? indicates the number of cells analysed, arrows show direction of cell migration and arrowheads mark filopodia. Scale bar is 10 Ám. |
|
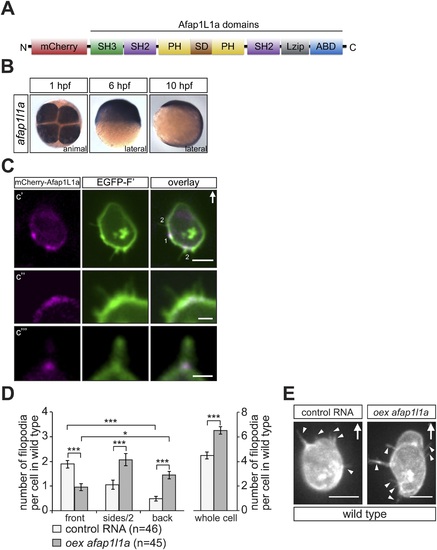
afap1l1a RNA expression, Afap1L1a protein localization and the role of the protein in filopodia formation. (A) Schematic structure of the Afap1L1a protein domains including a serine-threonine-rich substrate domain (SD) flanked by two PH domains, a leucine zipper (Lzip), an actin-binding domain (ABD), two SH2 and one SH3 domains. mCherry fluorophore was fused to the N-terminus of Afap1L1a to determine the subcellular localization of the protein. (B) Ubiquitous expression of the afap1l1a RNA in 1, 6 and 10-hpf embryos. (C) A single plane of PGCs expressing EGFP-F′ and the mCherry-Afap1L1a fusion protein reveals weak expression of the protein around the cell perimeter (C2) and a predominant strong association with the base of filopodia (C2?C4). In C2, one marks the site of a retracted filopodium, two the sites of extended filopodia and arrow indicates the direction of migration. (D) The number and distribution of filopodia in migrating PGCs overexpressing afap1l1a (dark bars) as compared with control PGCs (light bars). ?n? indicates the number of cells analysed. (E) Representative images of control (left) and of afap1l1a-overexpressing PGCs. Arrows indicate the direction of movement and arrowheads point at filopodia. Scale bars signify 10 Ám except for C3 and C4, where the scale is 3 Ám. |

