- Title
-
TNF Dually Mediates Resistance and Susceptibility to Mycobacteria via Mitochondrial Reactive Oxygen Species
- Authors
- Roca, F.J., and Ramakrishnan, L.
- Source
- Full text @ Cell
|
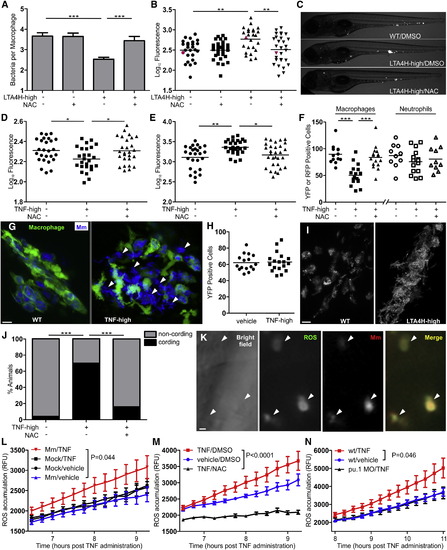
TNF-Mediated ROS Production Kills Both Mycobacteria and Infected Macrophages (A) Mean (ąSEM) number of bacteria per infected macrophage in WT and LTA4H-high larvae in presence or absence of 40 μM NAC. ***p < 0.001 (one way ANOVA with Tukey?s posttest). (B) Bacterial burden (FPC) in WT and LTA4H-high siblings in presence or absence of 40 μM NAC. **p < 0.01 (one-way ANOVA with Tukey?s posttest). Representative of two independent experiments. (C) Representative fluorescence microscopy images of individual fish in (B) represented by red dots. (D) FPC of 1 dpi larvae injected with TNF or vehicle in the presence or absence of 40 μM NAC. p < 0.05 (one-way ANOVA with Tukey?s posttest). Representative of two independent experiments. (E) FPC 3 dpi of the same fish in (D). *p < 0.05; ***p < 0.01 (one-way ANOVA with Tukey?s posttest). Representative of two independent experiments. (F) Number of yellow fluorescent macrophages or red fluorescent neutrophils in 2 dpi fish one day after injection with TNF or vehicle in presence or absence of 40 μM NAC. ***p < 0.001 (one-way ANOVA with Tukey?s posttest). (G) Confocal microscopy of granulomas in 3 dpi Tg(mpeg1:YFP) larvae injected with TNF or vehicle. White arrowheads show extracellular bacteria. Scale bar, 10 μm. (H) Number of yellow fluorescent macrophages in Tg(mpeg1:YFP) uninfected fish 1 day postinjection with TNF or vehicle. Difference not significant by Student?s t test. Representative of two independent experiments. (I) Representative fluorescence microscopy images of 4 dpi WT and LTA4H-high larva. Scale bar, 10 μm. (J) Percentage of animals in (D) and (E) with cording 4 dpi. ***p < 0.001 (Fisher?s exact test). (K) Representative fluorescence microscopy images of 1 dpi LTA4H-high larvae 6 hr after incubation with CM-H2DCFDA. Arrowheads point to infected macrophages. Scale bar, 10 μm. (L) Quantification of ROS production as relative fluorescence units (RFU) (ąSEM) in WT siblings infected with Mm or mock-infected (see Experimental Procedures) at the indicated time points after injection of TNF or vehicle. (two-way ANOVA). Representative of two independent experiments. (M) Quantification of ROS production as RFU (ąSEM) in WT infected siblings at the indicated time points after injection of TNF or vehicle in presence or absence of 40 μM NAC. (two-way ANOVA). (N) Quantification of ROS production as RFU (ąSEM) in infected WT or PU.1 morphant siblings at the indicated time points after injection of TNF or vehicle. (two-way ANOVA). (Also see Figures S1, S2, and S3). EXPRESSION / LABELING:
|
|
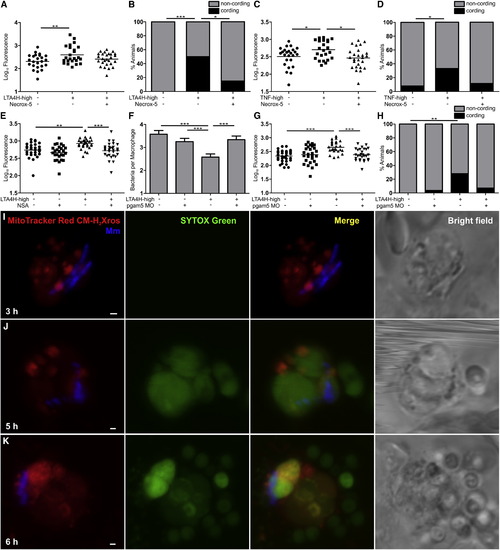
The TNF-RIP1-RIP3 Axis Mediates Necrosis of Infected Macrophages through Mitochondrial ROS Production (A) FPC in WT and LTA4H-high larvae in presence or absence of 10 μM Necrox-5. **p < 0.01 (one-way ANOVA with Tukey?s posttest). Representative of two independent experiments. (B) Percentage of animals in (A) with cording among WT and LTA4H-high larvae in presence or absence of 10 μM Necrox-5. *p < 0.05; ***p < 0.001 (Fisher?s exact test). (C) FPC in WT and LTA4H-high larvae injected with TNF or vehicle in presence or absence of 10 μM Necrox-5. *p < 0.05 (one-way ANOVA with Tukey?s posttest). (D) Percentage of animals in (C) with cording among WT and LTA4H-high larvae injected with TNF or vehicle in presence or absence of 10 μM Necrox-5. *p < 0.05 (Fisher?s exact test). (E) FPC in WT and LTA4H-high larvae in presence or absence of 10 μM Necrosulfonamide (NSA). **p < 0.01; ***p < 0.001 (one-way ANOVA with Tukey?s posttest). Representative of three independent experiments. (F) Mean (ąSEM) number of bacteria per infected macrophage in WT and PGAM5 morphant siblings on WT or LTA4H-high background. ***p < 0.001 (one way ANOVA with Tukey?s posttest). Representative of two independent experiments. (G) FPC in WT and PGAM5 morphant siblings on WT or LTA4H-high background. ***p < 0.001 (one-way ANOVA with Tukey?s posttest). Representative of two independent experiments. (H) Percentage of animals in (G) with cording among WT and PGAM5 morphants on WT or LTA4H-high background. **p < 0.01 (Fisher?s exact test). (I?K) Confocal and bright field images of different infected macrophages in 1 dpi larvae 3 (I), 5 (J), or 6 (K) hr post-TNF injection. Scale bars, 1 μm. (Also see Figure S6). |
Reprinted from Cell, 153(3), Roca, F.J., and Ramakrishnan, L., TNF Dually Mediates Resistance and Susceptibility to Mycobacteria via Mitochondrial Reactive Oxygen Species, 521-34, Copyright (2013) with permission from Elsevier. Full text @ Cell


