- Title
-
The ventral to dorsal BMP activity gradient in the early zebrafish embryo is determined by graded expression of BMP ligands
- Authors
- Ramel, M.C., and Hill, C.S.
- Source
- Full text @ Dev. Biol.
|
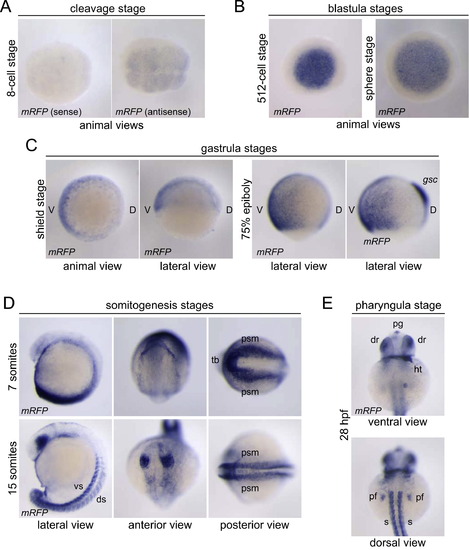
mRFPmRNA expression in BRE-mRFPzebrafish embryos ((A)?(E)) ISH for mRFP mRNA in BRE-mRFP embryos. In the rightmost panel of (C), double ISH with mRFP and the dorsal marker goosecoid (gsc). V, ventral; D, dorsal; vs, ventral somites; ds, dorsal somites; tb, tailbud; psm, presomitic mesoderm; pg, pineal gland; dr, dorsal retina; ht, heart tube; pf, pectoral fin bud; s, somites. |
|
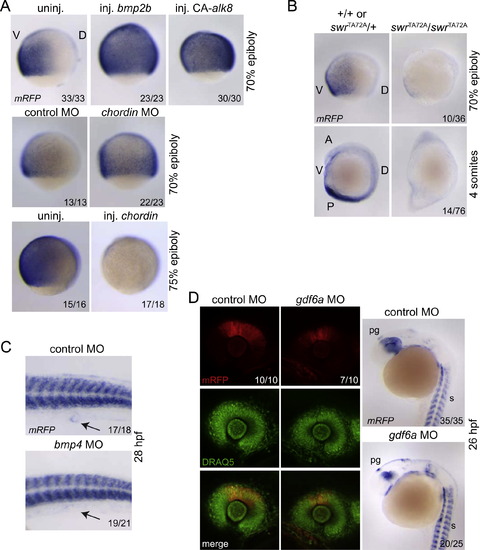
mRFP expression in BRE-mRFPembryos is abona fidereadout for BMP and GDF activities (A) mRFP ISH in BRE-mRFP embryos injected with chordin, bmp2b or CA-alk8 mRNAs or chordin MO. (B) BRE-mRFP expression in swrTA72A/swrTA72A homozygous embryos compared with +/+ or swrTA72A/+ siblings. The embryos shown resulted from a cross between swrTA72A/+ heterozygotes that contained the BRE-mRFP transgene. (C) mRFP ISH in BRE-mRFP embryos injected with a control or bmp4 MO. Arrows point to the cloaca. (D) BRE-mRFP embryos were injected with a control or gdf6a MO and mRFP expression in the dorsal retina was analysed (fluorescence and ISH). pg, pineal gland; s, somites. In (A) and (B), lateral views are shown; V, ventral; D, dorsal; A, anterior; P, posterior. In all cases, stages are indicated and the number of embryos out of the total analysed that showed the presented staining pattern is given. For (B), this number represents the number of homozygous mutant embryos out of the total number of embryos analysed. |
|
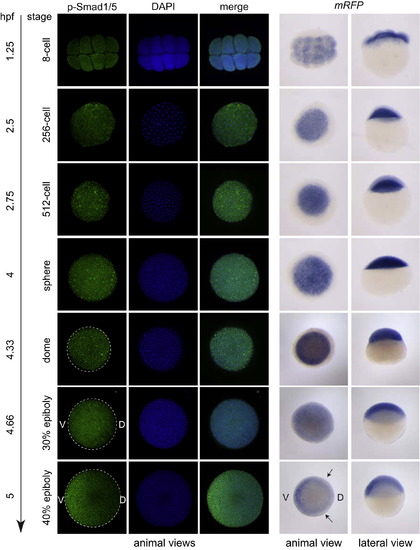
Establishment of the BMP activity gradient in zebrafish embryos. p-Smad1/5 IF and mRFP ISH in early stages BRE-mRFP embryos. Stages and views are indicated. V, ventral; D, dorsal. Arrows indicate the extent of mRFP staining. Note that the DAPI staining at the 8-cell stage did not resolve to single nuclei as the cells are dividing very quickly. |
|
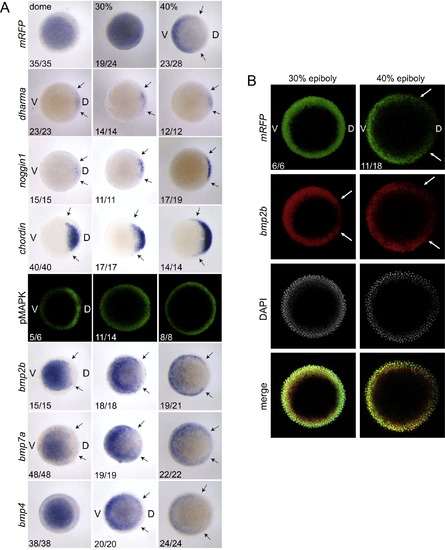
The establishment of the BMP activity gradient occurs in a pre-established gradient of BMP ligand expression. (A) BRE-mRFP or wild-type embryos stained for mRFP, dharma, noggin1, chordin, bmp2b, bmp7a or bmp4 mRNA by ISH or immunostained for pMAPK. Arrows indicate the extent of the domain of staining for a particular mRNA. The number of embryos out of the total analysed that showed the presented staining pattern is given. (B) DFISH for mRFP and bmp2b in blastula stages BRE-mRFP embryos. The fluorescent substrates used were fluorescein tyramide (mRFP) and Fast Blue (bmp2b, pseudocoloured in red). The images are the projection of a 10?12 picture stack taken at the margin of the blastoderm to avoid fluorescence from the yolk. V, ventral; D, dorsal. |
|
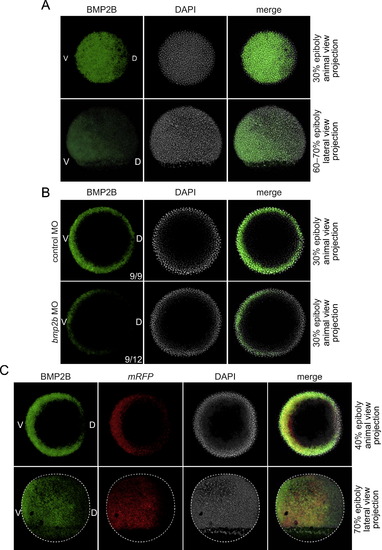
Graded expression of endogenous BMP2B protein results in graded transcriptional activity. (A) IF for BMP2B in wild-type embryos. (B) IF for BMP2B in control and bmp2b morphants. (C) Combined IF for BMP2B and ISH for mRFP in BRE-mRFP embryos. Note that there is some background staining for BMP2B that is due to autofluorescence from the yolk. Stages and views are indicated. The fluorescent substrate used for mRFP in (C) was Cy5 tyramide (pseudocoloured in red). In (A) and (C, bottom row), the pictures are the projection of a 25?30 stack of images taken from the edge of the embryo until about half way. In (B) and (C, top row), only the blastoderm margin was imaged. The white dotted line in (C, bottom row) shows the outline of the embryo. V, ventral; D, dorsal. |
|
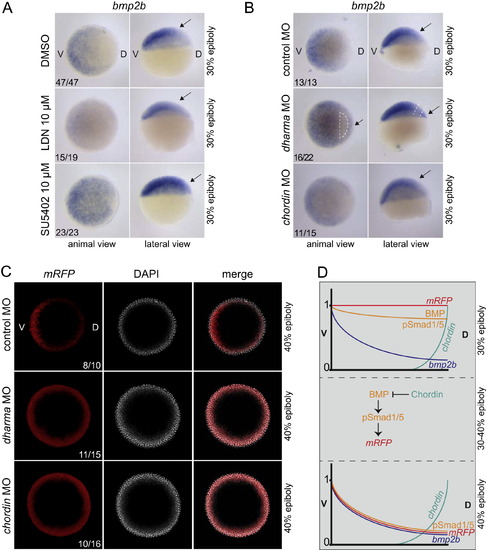
Regulation of graded bmp ligand transcription by Dharma, FGF and BMP signalling and consequences for the transcriptional activity of the BMP pathway. (A) bmp2b ISH in 30% epiboly wild-type embryos treated with DMSO, LDN-193189 (LDN) or SU5402. (B) bmp2b ISH in 30% epiboly wild-type embryos injected with either control, dharma, or chordin MOs. Ectopic bmp2b expression is detected at the margin upon Dharma knockdown but not in the dorsal ectoderm (white dotted lines). (C) mRFP ISH in BRE-mRFP embryos injected with either control, dharma, or chordin MOs. The fluorescent substrate used in (C) was Fast Blue (pseudocoloured in red). Note that the images are projection of a 10?12 picture stack taken at the margin of the blastoderm to avoid fluorescence from the yolk. (D) Graphical representation of the levels of mRFP, chordin, and bmp2b mRNAs, as well as BMP and p-Smad1/5 proteins across the D/V axis at 30% and 40% epiboly. Between these two stages, Chordin acts to antagonise residual BMP activity dorsally, resulting in a gradient of mRFP at 40% epiboly that reflects the gradient of BMP ligand transcription. For all panels in ((A)?(C)), stages and/or views are indicated. Arrows indicate the limit of the expression domain of the transcripts analysed. V, ventral; D, dorsal. |
Reprinted from Developmental Biology, 378(2), Ramel, M.C., and Hill, C.S., The ventral to dorsal BMP activity gradient in the early zebrafish embryo is determined by graded expression of BMP ligands, 170-82, Copyright (2013) with permission from Elsevier. Full text @ Dev. Biol.

