- Title
-
NBP, a zebrafish homolog of human Kank3, is a novel Numb interactor essential for epidermal integrity and neurulation
- Authors
- Boggetti, B., Jasik, J., Takamiya, M., Strähle, U., Reugels, A.M., and Campos-Ortega, J.A.
- Source
- Full text @ Dev. Biol.
|
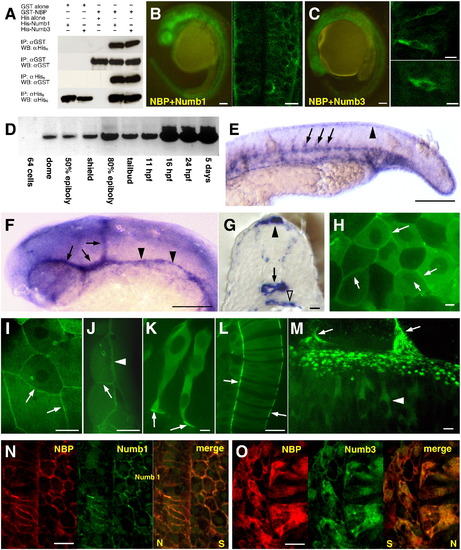
NBP and Numbs interact in vitro and in vivo. (A) Immobilized GST or GST?NBP fusion protein were mixed with either His alone, His-Numb1 or His-Numb3. The complexes were washed, analyzed by SDS-PAGE, and immunoblotted with either anti-His6 (top panel) or anti-GST (second panel). Immobilized His, His-Numb1 or His-Numb3 fusion proteins were mixed with either GST alone or GST?NBP. The complexes were washed, analyzed by SDS-PAGE and immunoblotted with either anti-GST (third panel) or anti-His6 (bottom panel). (IP: immunoprecipitation; WB: Western blot). (B) YFP in the BiFC assay was restored due to the NBP?Numb1 interaction in the whole embryo (left) and in the cells the fluorescent signal was detected at their periphery (right picture is showing cells of the neural tube). (C) NBP?Numb3 association resulted in the formation of YFP bimolecular complex in the whole embryo (left). At the cellular level, YFP signal was localized in the cytoplasm (right, upper picture represents the retina, bottom picture a cell of the neural tube). NBP exhibits distinct expression and localization patterns. (D) RT-PCR results showed that NBP expression started at dome stage and progressively increased during development. (E?G) Distribution of NBP transcripts revealed by whole-mount in situ hybridization. 24 hpf embryos (E, F lateral view, anterior to the left; G, transversal section of trunk region). Transcripts of NBP became concentrated in vascular endothelial cells of the head (arrows in E), axial (arrowheads in E) and intersomitic vessels (arrows in F), and in the median fin fold (arrowhead in F). Section in G shows NBP expression in the epidermis, median fin fold (filled arrowhead), at the basal pole of neural tube cells, in the dorsal aorta (arrow) and in the gut (open arrowhead). (H?M) NBP?GFP fusion protein localization. During gastrulation (ca. 75% epiboly; H?J) NBP?GFP is distributed uniformly in the cytoplasm. In deep cells it accumulates at the periphery in correspondence with the cell?cell contacts (arrows in H). In the EVL (I, J), the signal intensity significantly increases at the basal and lateral membranes (J, arrowhead points to the contact between EVL and yolk cell, arrow points to the contact between neighboring EVL cells; I shows a tangential section through the EVL covering deep cells, arrows point to lateral membranes). In two- to four-somite stage embryos, the cells exhibit cytoplasmic localization (K, L). In neuronal cells (K), NBP is accumulated at the basal pole at the contact with the basement membrane (arrows) and in notochord cells at the notochordal sheath (arrows in L). In 24 hpf embryos, NBP is cytoplasmic in neural tube cells (arrowhead in M points to a single neuronal cell). Z projection shows the punctuated pattern of neuronal cells-basement membrane attachments (arrows point to somitic boundaries). (N, O) Immunodetection of NBP and Numbs. For proteins co-localization, the antibody against c-myc (for NBP) was growing also in mouse but detected with a secondary antibody coupled with cy3, the antibody against HA (for Numbs) was growing in rat and detected by a secondary antibody conjugated with FITC. NBP and Numb1 when co-expressed were localized exclusively at the cell periphery (N). When NBP was co-expressed with Numb3, both proteins were distributed through the whole cells (O). N and O show the area around the border between the neural tube (N) and the somite (S). Scale bar: B and C left panels, E, F = 100 μm, B and C right panels, G?J, L, N, O = 10 μm, M = 5 μm, and K = 2 μm. |
|
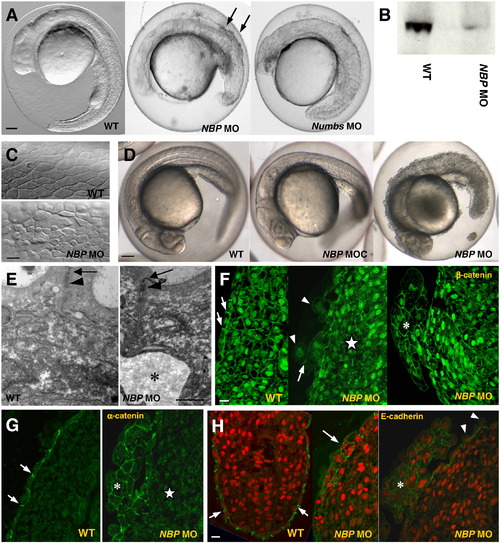
NBP and Numbs morphants show defects in development. Panels compare NBP morphants (NBP MO), NBP control morphants (NBP MOC) and Numbs morphants (Numbs MO) with wild-type embryos (WT). (A) 24 hpf embryos injected with either NBP MO or Numbs MO are delayed in growth and abnormally developed in comparison with wild-type embryos.Arrows point to dissociated cells in the dorsal region of the NBP morphants (lateral view, anterior towards the left). (B) Western blot analysis of protein extracts from 24hpf wild-type and NBP MO-injected embryos with the N1 polyclonal antibody against NBP. The wild-type extract gives a NBP-positive band of the expected size (99.57 kDa), whereas only a negligible amount of NBP is seen in extracts from the morphants. (C, E?H) Anomalous development of the epidermis. The epidermal cells of the NBP MO-injected embryos varied in size and shape, were separated by large intercellular spaces (C) and frequently were released from the surface (E, asterisk denotes the gap below the epidermal cells; arrowheads in F and H). Tumor-like structures emerged from the dorsal part of the embryo (asterisks in F, G, and H). They were composed of enlarged cells with round, β-catenin strongly positive nuclei (F) and with α-catenin (G), β-catenin (F) and E-cadherin (H) enriched in the cell?cell contacts. Stars point to inner tissue located just underneath the tumor-like structures where cells lack β-catenin in both nuclei and membranes (F) and α-catenin in membranes (G). Arrows point to junctions between neighboringepidermal cells enriched in β-catenin (F), α-catenin (G) and E-cadherin (H) in WT and to mislocalized E-cadherin in epidermal cells of NBP MO (H). Nuclei in H are stained by acridine orange. Scale bar: A, D = 100 μm, C, F?H = 20 μm, and E = 1 μm. |
|
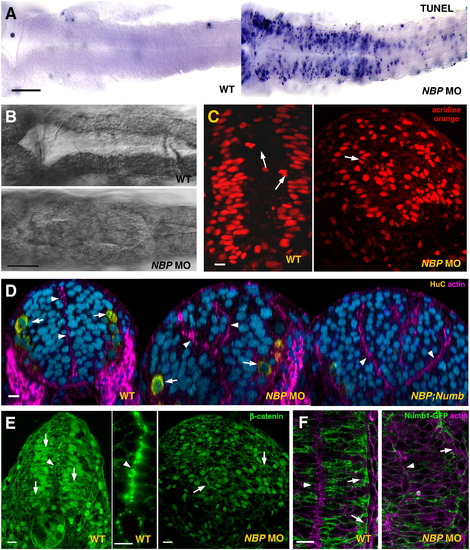
NBP is required for neural tube development. Panels compare NBP morphants (NBP MO) and double knockdown NBP;Numb mutants (NBP;Numb) with wild-type embryos (WT). (A) Many cells in the neural tube of the 24 hpf morphants, particularly of the embryos injected with 1 mM NBP MO, gave positive reaction in the TUNEL assay when compared to embryos either injected with the mismatch NBP MOC (at 1 mM, not shown) or un-injected (flat preparations, anterior to the left). (B) Abnormal growth in the ventricle of the hindbrain in NBP MO embryos (flat preparations, anterior to the left). (C?F) Neural tube defects in the NBP morphants. In embryos depleted from NBP (E, right picture) the cells of the neural tube frequently failed to form the usual epithelial structure composed of elongated columnar cells (arrows point to β-catenin membrane staining of baso-apically oriented polarized wild-type cells and of randomly oriented rounded cells in the morphant), the tissue appeared to be unorganized and did not form the typical midline enriched in β-catenin and actin ring characteristic for wild-type (D; E, arrowheads in the left and middle pictures). The nuclei (visualized by acridine orange) were not placed in their characteristic positions (C, left picture) but were scattered in the whole volume and their divisions were not restricted to the apical side of the neural tube (arrow in C, right picture, points to an anaphase in a deep region of the neural tube). For the morphant, E and C represent the same section probed by anti-β-catenin antibody (E) and acridine orange (C), respectively. (D) More than one neurocoel developed in the NBP morphants (middle panel), a phenotypic aberration enhanced in the NBP;Numb double morphants (arrowheads, neurocoel; arrows; HuC positive cells). (F) In the NBP morphant, Numb1 did not display the typical accumulation at the basal pole of cells (arrowhead, midline; arrow, basal pole of the neural cells). Scale bar: A, B = 100 μm, and C?F = 5 μm. |
|
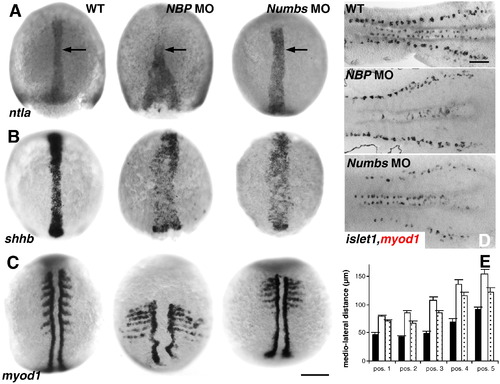
NBP and Numbs morphants are defective in C&E movements. Panels compare NBP morphants (NBP MO) and Numbs morphants (Numbs MO) with wild-type embryos (WT). A?C show dorsal view, anterior up. D shows flat preparations, anterior to the left. (A) ntla, 80% epiboly stage. Arrow indicates the notochord. (B) shhb, 90% epiboly stage. (C) myod1, six-somite stage. (D) islet1, myod1, six-somite stage. (E) Mediolateral distance (in μm) in five different positions along the anterior?posterior axis in NBP MO (open columns), Numbs MO (dotted columns) and wild-type embryos (filled columns). Scale bar: A?C = 200 μm, and D = 50 μm. EXPRESSION / LABELING:
PHENOTYPE:
|
|
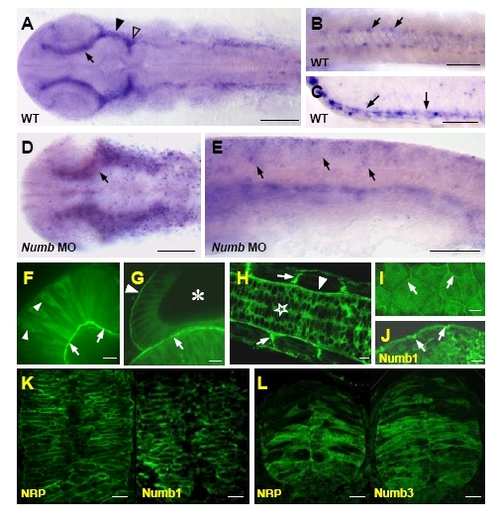
Distribution of NBP transcripts revealed by whole-mount in situ hybridization in wild-type (A-C) and Numb MO (D,E) embryos (all embryos are at 20-somite stage except for the 24 hpf embryo in C). (A,B,D) Flat preparations (anterior to the left), (C) section of the trunk region, (E) lateral view (anterior to the left). (A) NBP transcripts were ubiquitously detected and more pronounced in cells surrounding dorsally the eyes (arrow), at the ventral midbrain (filled arrowhead) and at the midbrain hindbrain boundary (open arrowhead). (B) Detail of the trunk region where NBP was also visible in few cells in each somite (arrows). (C) At 24 hpf, NBP was clearly concentrated at the epidermis (arrows point to the positive basal layer of keratinocytes). (D,E) NBP expression in Numb morphants presented a more disperse and expanded pattern in the head (D, compare with A) and in the trunk (E, compare with Fig. 2F) than in wild-type. NBP-GFP fusion protein localization (F-I). In 24 hpf embryos, NBP is cytoplasmic in neural tube cells (star in H), retinal cells (arrowheads in F) and otic epithelial cells (asterisk in G shows the otic vesicle). Over-accumulation of the fusion protein was observed at the basal pole of the cells at their attachments with the basement membrane (arrowhead in H points to the basement membrane surrounding the neural tube, arrows in H point to somitic boundaries to which muscle fibers anchor, arrows in F point to the inner basement membrane to which the retinal cells are attached, arrow in G points to the basement membrane between the otic vesicle and the hindbrain, arrowhead in G points to the basement membrane of the otic vesicle). In epidermal cells, NBP-GFP fusion is accumulated basolaterally (I shows tangential section, arrows point to the lateral membrane) similarly to Numb1 (arrows in J; this sample was fixated, embedded and probed with anti-HA antibody as in Supplemental Fig. S3K and Fig.2N). Immunodetection of NBP and Numbs (K,L; proteins were localized separately). The antibodies against the HA epitope (for Numbs) and c-myc epitope (for NBP) were growing in mouse and secondary antibodies were conjugated with Alexa 488. NBP and Numb1 when co-expressed were localized exclusively at the cell periphery (K). When NBP was co-expressed with Numb3, both proteins were distributed through the whole cells (L). Scale bar: A,D=100 μm, B,C,E=50 μF-L=10 μm. |
|
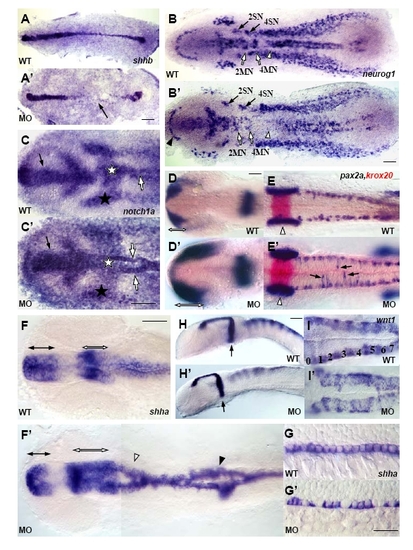
NBP is required for embryo development. All paired panels compare NBP MO morphants (MO) with wild-type embryos (WT). A-F′, I, I′ show flat preparations, anterior to the left. G-H′ show lateral view, anterior to the left. (A,A′) shhb (two-somite stage). Arrow in A′ indicates the area in which cells of the presumptive floor plate are not specified. (B,B?) neurog1 (four-somite stage). Filled arrowhead indicates the reduced telencephalon in NBP MO-injected embryo, open arrows point to motoneurons of rhombomeres 2 and 4 (2MN and 4MN), filled arrows point to sensory neurons of rhombomeres 2 and 4 (2SN and 4SN), open arrowheads point to the ventral neural clusters, not clearly distinguishable in the morphants. (C,C′) notch1a (tailbud/one-somite stage, head region). Filled arrow indicates the area of expression in the presumptive forebrain broader and shorter in the NBP MO-injected embryo, filled stars indicate the lateral stripes of expression in the ectoderm, open stars point to the area of high transcript density in the prospective hindbrain, almost missing in the morphant, open arrows indicate the midline stripe of expression in the prechordal mesoderm splitted in the NBP MO-injected embryo. (D-E′) pax2a, krox20 (18-somite stage, D,D′: head region; E,E′: hindbrain region). Open arrows indicate the length of pax2a expression in the optic primordial, arrows indicate scattered interneurons in hindbrain area, open arrowheads indicate the otic vesicle. (F-G′) shha (21-somite stage; F,F′: head-trunk region; G,G′: trunk region, note the stained floorplate cells). Filled arrows indicate the ventral anterior diencephalon reduced in the morphant, open arrows point to the ventral midbrain expanded in the NBP morphant, open arrowhead indicates the splitted expression in the hindbrain, filled arrowhead indicates the split in the spinal cord. (H-I′) wnt1 (25-somite stage; H,H?: head-trunk region; I,I′: hindbrain region). Filled arrows indicate the midbrain hindbrain boundary, numbers mark locations of the corresponding rhombomeres. Scale bar =50 μm. |
|
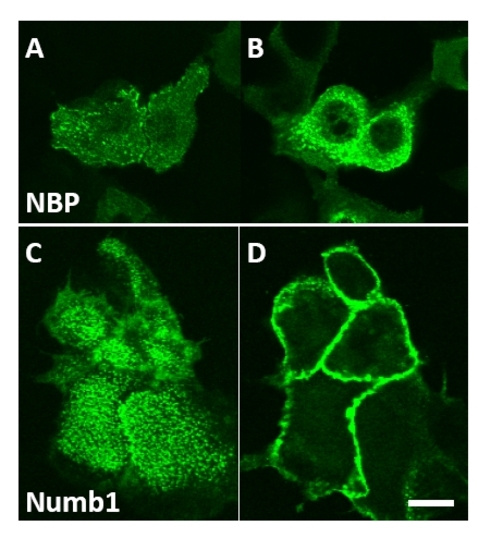
NBP-GFP and Numb1-GFP localize basally in mice keratinocytes. (A,C) NBP and Numb1 localize basally in differentiated cells cultured in vitro (48 h high Ca2+); (B) NBP is localized in the cytoplasm while Numb1 (D) exclusively at the plasma membrane. Pictures were selected from sequential Z stacks. Bar=20μm. |
Reprinted from Developmental Biology, 365(1), Boggetti, B., Jasik, J., Takamiya, M., Strähle, U., Reugels, A.M., and Campos-Ortega, J.A., NBP, a zebrafish homolog of human Kank3, is a novel Numb interactor essential for epidermal integrity and neurulation, 164-174, Copyright (2012) with permission from Elsevier. Full text @ Dev. Biol.

