- Title
-
Regulation of intrahepatic biliary duct morphogenesis by Claudin 15-like b
- Authors
- Cheung, I.D., Bagnat, M., Ma, T.P., Datta, A., Evason, K., Moore, J.C., Lawson, N.D., Mostov, K.E., Moens, C.B., and Stainier, D.Y.
- Source
- Full text @ Dev. Biol.
|
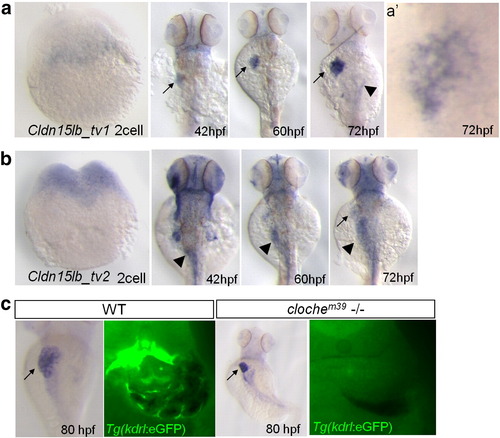
The two transcript variant of cldn15lb are differentially expressed during development. a–b, In situ hybridization with transcript variant-specific probes. a, cldn15lb_tv1 is not expressed at the 2-cell stage. At 42 hpf, it is expressed mainly in the liver (arrow) with some expression in the head. Its expression in the liver intensifies through 60 and 72 hpf. Low level expression is observed in the pancreas at 72 hpf (arrowhead). a′, Detailed analysis at 72 hpf shows that expression in the liver is in a unique, tree-like pattern. b, cldn15lb_tv2 is detected at 2-cell stage indicating that it is maternally deposited. cldn15lb_tv2 transcripts can be found in the gut (arrowhead), head, and pectoral fins at 42 hpf. Minimal expression of cldn15lb_tv2 is found in the liver at 72 hpf (arrow). c, Left, in situ hybridization of cldn15lb in wildtype and clochem39mutant larvae. Probe used was against the 3′UTR of cldn15lb and thus labels both transcripts. Right, vibratome cross section of in situ hybridization with fluorescence microscopy. In situ hybridization signal does not co-localize with GFP-positive endothelial cells and is present in clochem39 mutants, which lack most endothelial cells, indicating that cldn15lb is not expressed in the intrahepatic vasculature. EXPRESSION / LABELING:
|
|
Cldn15lb is dynamically expressed in hepatocytes and biliary epithelial cells during development. a–b, Single confocal plane of MDCK cysts stably expressing Cldn15lb-GFP immunostained with the tight junction markers ZO-1(a) or Occludin (b). Cldn15lb-GFP co-localizes with the tight junction markers (arrows). c–e, 150 μm transverse sections through the liver at 80 (c), 100 (d), and 120 (e) hpf. c, At 80 hpf, Cldn15lb immunostaining is observed in biliary epithelial cells (BECs) (arrows) as marked by Tg(Tp1bglob:eGFP) expression as well as the surrounding hepatocytes (arrowheads). d, At 100 hpf, Cldn15lb immunostaining in BECs (arrows) increases while that in hepatocytes (arrowheads) becomes more punctate. e, At 120 hpf, Cldn15lb immunostaining is only observed in BECs (arrows). Green: Tg(Tp1bglob:eGFP); red: Cldn15lb antibody. The antibody also labels cells in the gut (g). Scale bars are 10 μm. EXPRESSION / LABELING:
|
|
Hepatocyte polarization and bile canaliculi development are affected in cldn15lbfh290 mutant livers. a, Schematic of the TILLING mutation. The nonsense mutation is situated at the end of exon1a making this mutation specific to cldn15lb_tv1. The mutation is situated in the sequence encoding the extracellular region immediately before the second transmembrane domain. b–c, Brightfield pictures of wildtype (b) and mutant (c) larvae at 5 dpf. The overall body morphology and liver size, as assessed by Tg(fabp10:RFP)gz12 expression, appear unaffected. d–e, In situ hybridization analysis of wildtype (d) and mutant (e) larvae at 80 hpf with a probe that recognizes both transcript variants. The mutant larvae exhibit decreased expression of cldn15lb in the liver and pancreas while gut expression appears unaffected. f–g, 150 μm transverse sections through the liver at 100 hpf. Green: Tg(Tp1bglob:eGFP); red: Cldn15lb antibody. Wildtype larvae (f) express Cldn15lb in BECs (arrows). Cldn15lb expression in mutant larvae (g) is severely reduced (arrowhead). h–i, Whole-mount analysis of 80 hpf larvae stained for pan-cadherin (green) and ZO-1(mouse) (red). Anti-pan-cadherin outlines hepatocytes at lower intensity while it marks BECs at higher intensity. Anti-mouse ZO-1 outlines the intrahepatic vasculature. h′–i′, Red: vasculature; Yellowish-green: biliary network. Hepatocytes are color-coded by their cell shape and location relative to the biliary and vascular networks. Hepatocytes that are sandwiched between the networks and columnar in shape are labeled in light blue. These cells appear to be fully polarized. Hepatocytes that are either columnar but not sandwiched between the two networks or are cuboidal and between the networks are labeled in light purple. Hepatocytes that are not polarized are non-uniformly shaped and not lined by the networks. These cells are labeled in dark purple. Most hepatocytes in mutant larvae do not appear to be polarized and are found in rosettes (* in i′) while a higher number of hepatocytes in wildtype larvae are polarized. Gallbladder (gb) j–k, Whole-mount analysis of 100 hpf Tg(fabp10:rasGFP)s942 larvae stained for BSEP (red) which marks canaliculi. Canaliculi in mutant livers are shorter and wider than those in wildtype livers. Insets highlight the boxed areas (red channel only). l, Percentage of hepatocytes that are polarized (light blue), semi-polarized (light purple), and non-polarized (dark purple). Wildtype livers have significantly more polarized cells while having almost three times fewer non-polarized cells (* p = 0.0018, ** p = 0.0012). Error bars represent SEM. All scale bars are 10 μm. EXPRESSION / LABELING:
PHENOTYPE:
|
|
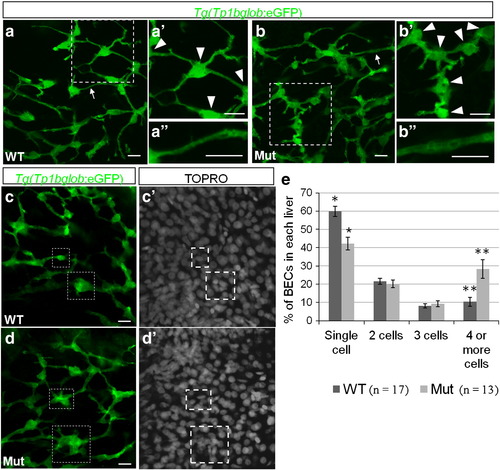
The intrahepatic biliary network is disorganized in cldn15lbfh290 mutant livers. a–d, Whole-mount confocal projections of Tg(Tp1bglob:eGFP)um14 wildtype and mutant livers at 100 hpf. a–b, The biliary network in the mutant larvae appears to be disorganized. a′–b′, Magnification of the boxed regions. In the mutant livers, the cell bodies of the BECs (arrowheads) are closer together, and thus the ducts are shorter. a′′–b′′, Magnification of the duct labeled by the arrow. In the mutant livers, the ducts appear dilated. c–d, At 100 hpf, a majority of the BECs present as individual cells in wildtype livers. In the mutant livers, multiple BECs are clustered together at this stage (boxed regions). e, Percentage of BECs that present as single cells, doubles, triples, or in clusters of four or more cells. Wildtype livers have almost double the number of single cells and almost 3 times less cells in clusters of 4 or more cells (* p = 0.00056, ** p = 0.006). Error bars represent SEM. All scale bars are 10 μm. |
|
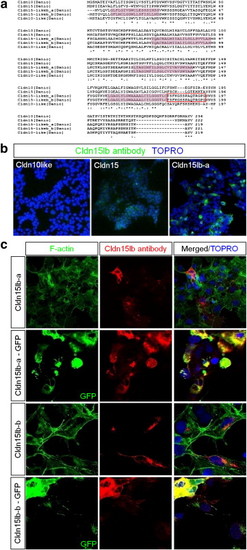
Generation and validation of Cldn15lb peptide antibody. a, Sequence alignment between zebrafish Cldn10, Cldn15, Cldn15lb-a, Cldn15lb-b, and Cldn10l. [Cldn15lb-a and -b are the proteins encoded by cldn15lb_tv1 and cldn15lb_tv2, respectively.] Purple shading boxes indicate transmembrane regions. Red box highlights the epitope targeted by the peptide antibody. b, HEK293 cells were transiently transfected with constructs expressing Cldn10l, Cldn15, or Cldn15lb-a. Immunofluorescence with peptide antibody generated against Cldn15lb recognized Cldn15lb-a only. c, Cos7 cells were transiently transfected with untagged or GFP-tagged version of either transcript variant. The antiserum recognized cells that were transfected with either untagged transcript variant and it co-localized with the GFP-tagged version. Thus, the polyclonal antibody in the serum recognizes Cldn15lb but does not distinguish between the 2 isoforms. |
|
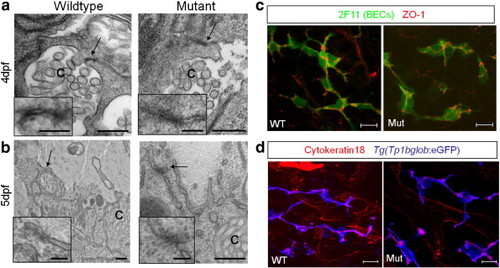
Junctions are present in cldn15lbfh290 mutant livers. Electron microscopy at 4 (a) and 5 (b) dpf. Insets are magnification of the arrowed areas showing junctional complexes that lie between hepatocytes and bile canaliculi [c]. Junctional complexes can be found in both wildtype and mutant livers. Scale bars are 0.4 μm (inset: 0.1 μm). (c) Whole-mount confocal projection of 110 hpf larvae immunostained with 2F11 and ZO-1(rabbit) to mark BECs and tight junctions between BECs, respectively. Tight junctions appear to be properly localized between BECs in the mutant livers. (d) Whole-mount confocal projection of 100 hpf Tg(Tp1bglob:eGFP)um14 larvae immunostained for cytokeratin-18 to mark the canals of Hering. These canals, which line the biliary ducts, appear normal in mutant livers. Cytokeratin-18 immunostaining also labels the intrahepatic vasculature. Scale bars in c and d are 10 μm. |
|
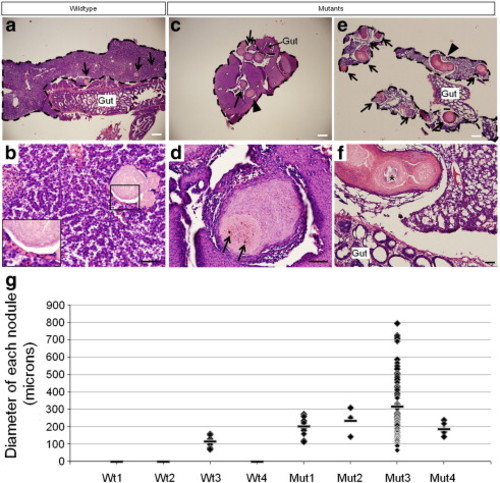
Pathology in adult livers. Low magnification views of wildtype (a) and mutant (c, e) livers stained with hematoxylin and eosin. Scale bars are 200 μm. Lesions (arrows) are present in 1 of 4 wildtype and 4 of 4 mutant livers analyzed (g). Each liver is outlined by dashed lines. Magnified views of the same livers (b, wildtype; d, f, mutants). Scale bars are 40 μm. a, Small lesions (70–160 μm in diameter) are scattered throughout the liver parenchyma in one of four wildtype livers. b, An example of one of the lesions found in the wildtype liver. They appear to be well-circumscribed lesions composed of approximately 1–3 layers of flattened epithelioid cells (inset) surrounding eosinophilic material containing occasional golden-brown pigment granules and fragments of nuclear debris. Minimal inflammatory cells are present around the lesions and the hepatic parenchyma appears normal. c, An example of the mutant livers which show abundant and larger lesions (arrows and arrowhead). d, Magnified view of the nodule marked by the arrowhead in c. These lesions have a more exuberant epithelioid proliferation at the periphery, often more than 10 cell layers thick, and contain degenerating cellular debris, golden-brown pigment (arrows), and scattered calcifications. Focal inflammation surrounds a few lesions but they are, for the most part, associated with minimal adjacent inflammatory reaction. The hepatic parenchyma of the mutants is unremarkable in some areas but in other areas shows varying degrees of disorganization. e, Mutant #3 shows abundant and occasionally coalescing lesions (arrowhead). f, A magnified view of the coalesced lesion shows calcified material in the center (*). The hepatic parenchyma in mutant #3 shows hepatocyte dropout and increased fibrous tissue surrounding several of the lesions. g, Plot of the diameter of each lesion found in each liver. The bar indicates the average lesion diameter. Three of the four wildtype livers did not present with lesions. The plot shows that the severity of the phenotype varies in mutants but that on average, the lesions are almost twice to three times the size of those in wildtype #3. Mutant #3, the most severely affected, presented with 74 lesions of varying diameters. |
Reprinted from Developmental Biology, 361(1), Cheung, I.D., Bagnat, M., Ma, T.P., Datta, A., Evason, K., Moore, J.C., Lawson, N.D., Mostov, K.E., Moens, C.B., and Stainier, D.Y., Regulation of intrahepatic biliary duct morphogenesis by Claudin 15-like b, 68-78, Copyright (2012) with permission from Elsevier. Full text @ Dev. Biol.

