- Title
-
Mitotic patterns in the migrating lateral line cells of zebrafish embryos
- Authors
- Laguerre, L., Ghysen, A., and Dambly-Chaudière, C.
- Source
- Full text @ Dev. Dyn.
|
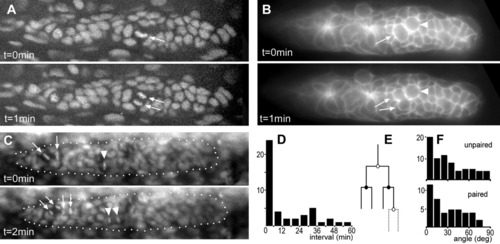
Unpaired and paired mitoses in green fluorescent protein (GFP) reporter lines. A: Metaphase (arrow) and telophases (arrows) visualized in the Tg(h2afv:GFP) line. B: Premitotic cell (arrow) and postmitotic cells (arrows) visualized in the Tg(-8.0cldnb:lynGFP) line; note that the adjacent cell (arrowhead) has a typically premitotic morphology. C: Unpaired mitosis (arrowhead) and paired mitoses (arrows) in the Tg(h2afv:GFP) line. D: Distribution of time intervals between adjacent mitoses. E: Schematic drawing of the proposed determinate lineage. The two paired mitoses are represented by the black circle; the unpaired mitoses by white ones. Plain lines: four-cell lineage; dashed lines: five-cell lineage (see text). F: Distribution of the angles between axes of division and of migration for unpaired and paired mitoses. EXPRESSION / LABELING:
|
|
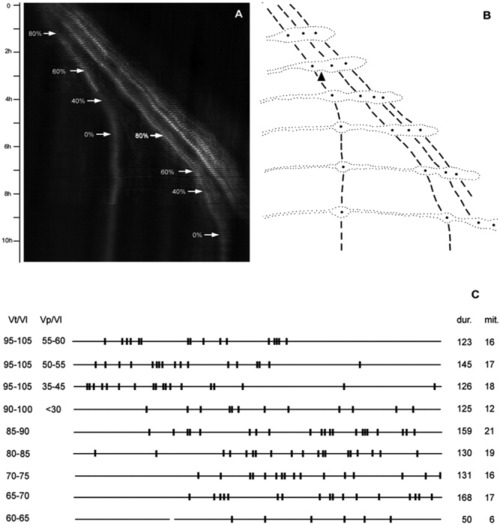
Dynamics of migration speed. A: Kymograph of a migrating primordium, illustrating the progressive slowing down of the proneuromasts. Deposition was arbitrarily taken as the time when Vt reaches 65% of Vl. At this stage, the speed of the trailing cells was renamed Vp (speed of the proneuromast cells). B: Outline of the primordium and neuromasts corresponding to the kymograph in A, to illustrate the different phases of deposition. The center of each rosette is represented by a black dot. C: Spatial distribution of mitoses for different ratios of Vt (speed of the trailing cells) or Vp (speed of proneuromast cells) over Vl (speed of the leading cells). Ratios were expressed as %. Time-lapses were divided in stretches corresponding to the different Vt/Vl and Vp/Vl intervals given at the left. Each line corresponds to the length of a primordium (except for the lowest one, see below). Black bars indicate the position of the mitoses recorded during the corresponding interval. On the right are shown the cumulated duration of all stretches (minutes), and the total number of mitoses recorded for each interval. The lowest bar corresponds to the stage where the trailing cells are moving at a speed lower than 65% of the leading cells, that is, when a proneuromast is effectively separating from the primordium. The separation between primordium and proneuromast is represented by a break in the line. The rightmost part of the bottom line, therefore, corresponds to the primordium length, that is, to the whole length of all other lines. |
|
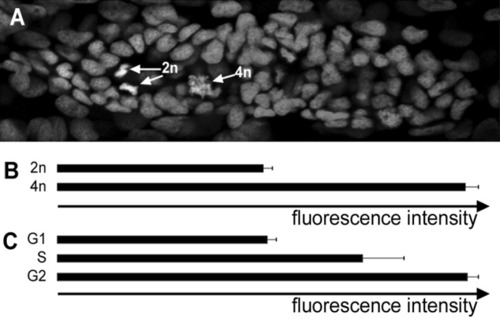
Patterning of the cell cycle. A: One focal plane of a primordium after Hoechst labeling. Each primordium was imaged as a Z-stack with 1 micron steps. The fluorescence of each nucleus was measured in each plane, and the ploidy was measured as the total intensity of fluorescence, as explained in the Experimental Procedures section. B: Total fluorescence of 20 nuclei that were in pro- or metaphase (2n), and of 12 nuclei in telophase (4n); fluorescence is expressed in arbitrary units. C: Total fluorescence in all the nuclei of the two primordia shown Figure 4. The nuclei were classified as G1, S, or G2 depending on the ratio of their total fluorescence relative to the 2n and 4n levels. |
|
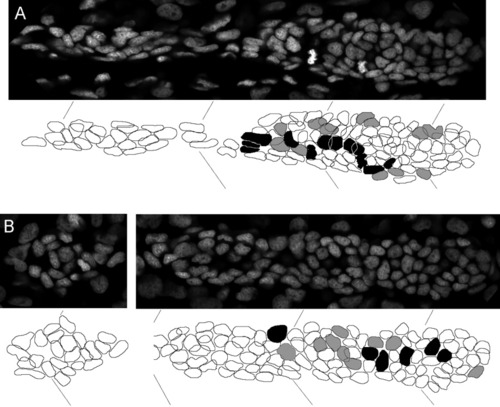
Distribution of S and G2 phases. A: Distribution of cells in G2 (black) and S phase (gray) in a primordium that is one somite away from the last deposited neuromast, presumably corresponding to Vt/Vl = 0.8. B: Distribution of cells in G2 (black) and S phase (gray) in a primordium that is four somites away from the last deposited neuromast, presumably corresponding to Vt/Vl = 0.6. |
|
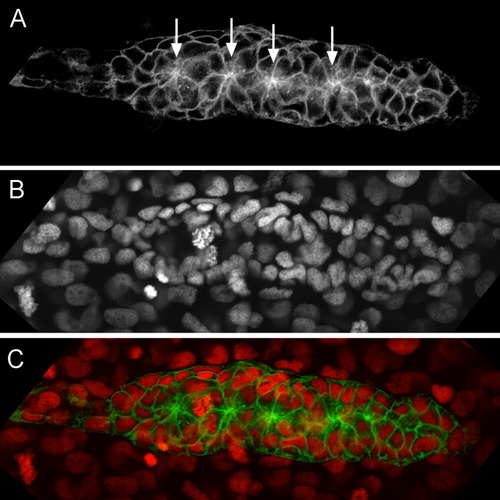
Rosette formation. A: The apical constriction of radially organized cells forming a rosette is easily detected in the Tg(-8.0cldnb:lynGFP) line (arrows). B: Rosette organization is also evidenced by the position of the nuclei, which are deeper at the center of the rosette than in its annulus; the nuclei are labeled with Hoechst. C: Superimposition of A and B falsely colored, to illustrate the correspondence between apical spots and deep nuclei. This primordium is unusual in having four rosettes instead of the usual three. |
|
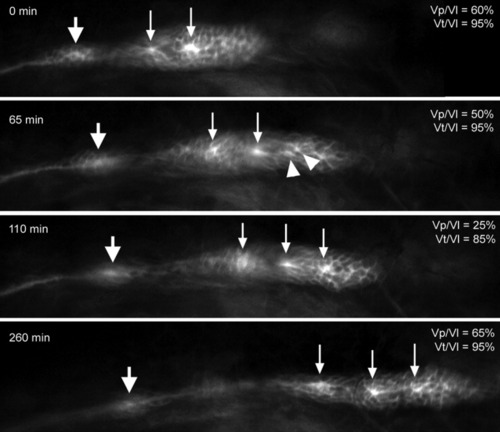
Dynamics of rosette formation. A new rosette forms as Vp/Vl decreases from 60 to 30%; at intermediate stages of Vp/Vl around 50%, two or three condensations are often observed that eventually converge into a single focus. Thick arrow: last deposited proneuromast. |
|
Cell death in nonmigrating primordium visualized by acridine orange staining of living embryos. A: In a wild-type embryo at 28 hours postfertilization (hpf). B: In a MO-sdf1a embryo at 28 hpf. |

