- Title
-
Expression and water calcium dependence of calcium transporter isoforms in zebrafish gill mitochondrion-rich cells
- Authors
- Liao, B.K., Deng, A.N., Chen, S.C., Chou, M.Y., and Hwang, P.P.
- Source
- Full text @ BMC Genomics
|
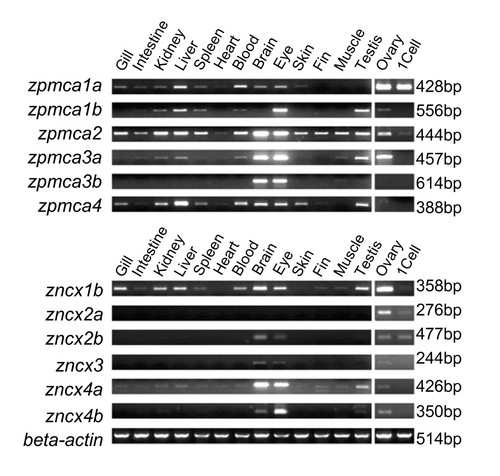
Expression patterns of zebrafish plasma membrane Ca2+-ATPases (PMCAs) and Na+/Ca2+ exchangers (NCXs) in various tissues by RT-PCR analysis. The zebrafish beta-actin was used as internal control to evaluate the relative amounts of cDNAs. The expected amplicon sizes are shown on the right. 1Cell, cDNA from the 1-cell stage of zebrafish embryos. |
|
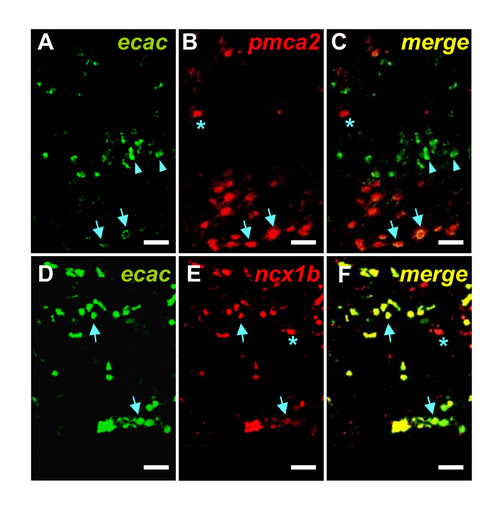
Double fluorescence in situ hybridizations of zecac/zpmca2 (A-C) and zecac/zncx1b (D-F) in frozen sections of zebrafish gills. A and D, zecac mRNA; B, zpmca2 mRNA; C, merged image of A and B; E, zncx1b mRNA; F, merged image of D and E. Arrow indicates the colocalization of zecac/zpmca2 (A-C) and zecac/zncx1 (D-F), respectively. An asterisk (*) indicates the zpmca2 signal without zecac colocalization (A and B) and the zncx1b signal without zecac colocalization (D and E). Scale bar = 20 μm. |
|
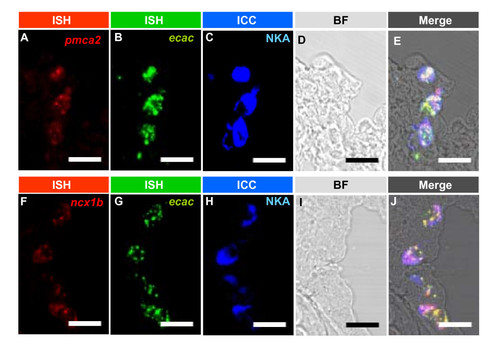
Triple fluorescence in situ hybridizations (ISH) and immunocytochemistry (ICC) for zecac mRNA/zpmca2 mRNA/Na+-K+-ATPase (A-E) and zecac mRNA/zncx1b mRNA/Na+-K+-ATPase (F-J) in frozen sections of zebrafish gills. A-E are the same section, and F-J are another section. A, zpmca2 mRNA; B and G, zecac mRNA; C and H, Na+-K+-ATPase (NKA); D and I, bright field (BF); E, merged image of A-D; J, merged image of F-I. Colocalization of the 3 transporter mRNAs and protein was found respectively in E and J. Scale bar = 20 μm. |


