- Title
-
her3, a zebrafish member of the hairy-E(spl) family, is repressed by Notch signalling
- Authors
- Hans, S., Scheer, N., Riedl, I., Von Weizsacker, E., Blader, P., and Campos-Ortega, J.A.
- Source
- Full text @ Development
|
Distribution of her3 transcripts revealed by whole-mount in situ hybridisation. (A) 30% epiboly. her3 transcription is first detected in the blastoderm. (B) 80% epiboly. The single initial transcription domain has split into two, each of which lies within the presumptive neural primordium. (C) Cross-section of B showing transcription in the epiblast. (D) Flat preparation of a tailbud-stage embryo. The her3 expression domains form two broad longitudinal stripes in the intermediate lateral regions of the neural plate. Compare this with the embryo in D', which was hybridised with a neurog1 probe (see Blader et al., 1997; Geling et al., 2003). The two transcription patterns are complementary. E,E' (two somites) and F,F' (four somites) show that the her3 domains occupy the regions in which neurog1 is not transcribed. 2MN and 4MN, motoneurones of rhombomeres 2 and 4. 2SN and 4SN, sensory neurones of rhombomeres 2 and 4. (G,H) Eight-somite (G) and 16-somite stage (H) show that transcripts of her3 later become undetectable in anterior regions but continue to be expressed in single cells within caudal regions of the developing spinal cord (arrows). (I,J) Double in situ hybridisation with her3 (blue) and egr2b (red), and with her3 (blue) and pax2a (red), respectively. Note that the her3 domain progressively extends into rhombomere 5 (r5) (arrows). (K,L) In situ hybridisation with her3 (blue) and her5 (red), to show that the rostral margin of the her3 domain corresponds to the anterior border of the midbrain primordium. The her5 domain is included within the her3 domain (between arrows). Refer to the text for further details. Anterior is towards the top in all embryos. EXPRESSION / LABELING:
|
|
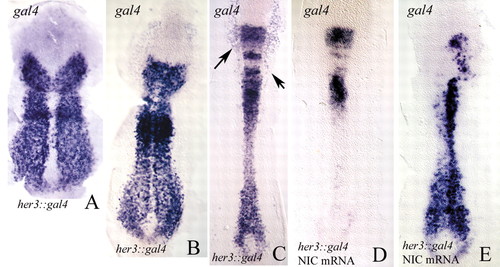
(A-C) Flat preparations of her3::gal4 embryos (tail-bud, A; two-somite stage, B; six-somite stage, C) labelled by in situ hybridisation with a gal4 probe. The gal4 pattern closely corresponds to the endogenous her3 transcription pattern. Compare with Fig. 1. The arrows in C indicate areas of gal4 expression in epidermal tissues. In cranial regions of the developing spinal cord, reporter mRNA persists for longer than do the transcripts of the endogenous her3 gene (see Fig. 1). (D,E) Two examples of her3::gal4 embryos injected with mRNA for notch1a-intra and probed for gal4. Note that transcription of her3::gal4 is repressed. Anterior is towards the top. |
|
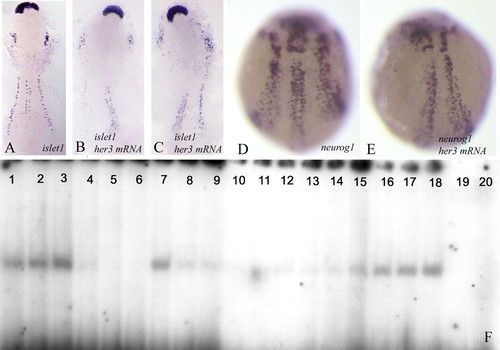
(A-C) Flat preparations; (D,E) wholemounts of two-somite stage embryos. (A,D) Wild-type embryos; (B,C,E) embryos injected with her3 mRNA encoding the full-length protein. The embryos were hybridised with islet1 (A-C) or neurog1 (D,E). Note that transcription of islet1 and neurog1 is reduced in the injected embryos. Refer to the text for further details. Anterior is towards the top. (F) Her3 protein can bind to N boxes in the neurog1 promoter. Lanes 1-3 were loaded with increasing amounts of Her3 protein (1, 3 and 5 µg, respectively) and with a labelled (5000 cpm) oligonucleotide corresponding to part of the neurog1 promoter and including two N-boxes (see NP oligonucleotide sequence in Materials and methods). A clear shift in the electrophoretic mobility of the oligonucleotide can be detected. Lanes 4-6 contain 3 µg aliquots of Her3 protein and 5000 cpm of the labelled oligonucleotide, together with increasing amounts of unlabelled oligonucleotide (5, 20 and 40 ng, respectively). Inclusion of non-radioactive homologous competitor prevents the band shift. Lanes 7-9 contain 3 µg of Her3 protein, 5000 cpm of labelled oligonucleotides, and 5, 20 and 40 ng of a heterologous competitor. Binding of the labelled probe is reduced but not completely blocked. Lanes 10-12, 13-15 and 16-18 contain 1, 3 and 5 µg of Her3 protein, and 5000 cpm of labelled oligonucleotides in which both N-boxes (lanes 10-12) [the N1 box (13-15) or the N2 box (16-18)] have been mutated (see Materials and methods). Mutation of both N-boxes reduces the affinity for Her3. As a control, lanes 19 and 20 were loaded with 5000 cpm of the wild-type (19) and mutated (20) oligonucleotides without any Her3 protein. EXPRESSION / LABELING:
|
|
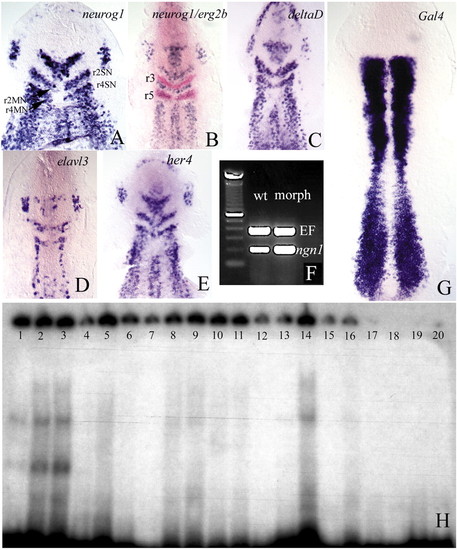
(A-E) Flat preparations of embryos at the one-somite (A) and two- to three-somite (B-E) stages, which had been injected with morpholino oligonucleotides against her3. The embryos were hybridised with the probes indicated. Note the ectopic expression of neurog1, deltaD and elavl3 transcripts in the region between 2SN and 2MN, and 4SN and 4MN (see Fig. 1D′). Double in situ hybridisation with egr2b (B) shows that ectopic expression is restricted to rhombomeres 2 and 4. (r3, r5: rhombomeres 3 and 5). (F) The density of her3 transcripts following injection of her3 morpholinos is higher than in the wild type (compare with Fig. 1F). (D) Wild-type embryo injected with her3 morpholinos, showing that the density of her3 transcripts is higher than in the controls (compare with Fig. 1E), suggesting that Her3 regulates its own transcription. (H) Her3 protein can bind to N boxes in the her3 promoter. Lanes 1-3 contain increasing amounts of Her3 protein (1, 5 and 10 µg, respectively) and 8000 cpm of an oligonucleotide derived from the her3 promoter that includes the N1 box (see Materials and methods). A clear shift in the electrophoretic mobility of the oligonucleotide can be detected. The presence of several bands suggests binding by Her3 oligomers. Lanes 4-6 contain 3 µg of Her3 protein, 8000 cpm of the labelled N1 oligonucleotide, and increasing amounts of unlabelled oligonucleotide (0.4, 5 and 6 pM, respectively). Binding to the labelled probe is reduced because the unlabelled oligonucleotides compete for Her3. Lanes 7-9 show the same experiment using an oligonucleotide that contains the N2 box (refer to Materials and methods). The shifted band is weaker. Lanes 10-12 show that, also in this case, the non-radioactive oligonucleotide competes for Her3. Lanes 7-9 and 10-12 contain the same amounts of protein and radioactive and non-radioactive DNA as lanes 1-3 and 4-6, respectively. Lanes 13-14 and 15-16 show the effects of mutating either the N1 or the N2 box on band shifting. Lanes contain 1 and 5 µg of Her3 protein and 8000 cpm of the labelled oligonucleotides. As a control, lanes 17-20 contain 8000 cpm of the wild-type (17-18) and mutated (19-20) oligonucleotides, but no Her3 protein.
EXPRESSION / LABELING:
|
|
Expression of elavl3 (A, three-somite stage) and neurog1 (C, one-somite stage) in wild-type embryos is compared with the expression of the same genes in embryos that had been injected with her3eng (B) or her3VP16 mRNA (D). Whereas the injection of her3eng mRNA leads to loss of primary neurones, her3VP16 causes ectopic activation of neurog1. EXPRESSION / LABELING:
|
|
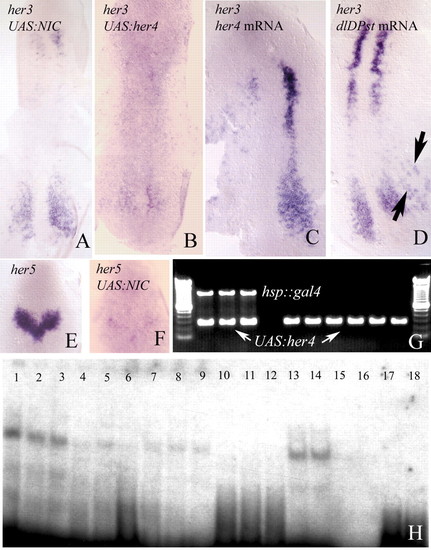
(A-D) her3 in situ hybridisation in two-somite embryos. Transcription of her3 is repressed by Gal4 mediated misexpression of notch1a-intra (A) or her4 (B), and by injection of the her4 mRNA (C). her3 expression is also repressed by injection of neurog1 mRNA (D), probably as an indirect consequence of the activation of her4 (Takke et al., 1999). (E,F) her5 in situ hybridisation to two-somite embryos. Transcription is repressed following misexpression of notch1a-intra by the Gal4-UAS technique. Misexpression of her4 represses the transcription of her5 to the same extent. (G) Genotyping of individual embryos by PCR. Embryos that exhibit transcriptional repression of her3 (or of her5) carry both transgenes (hsp::gal4 and UAS:her4, three first lanes). Phenotypically wild-type embryos carry one transgene. (H) Her4 protein can bind to N boxes in the her3 promoter. Lanes 1-3 contained increasing amounts of Her3 protein (2, 3 and 4 µg, respectively) and 8000 cpm of an oligonucleotide derived from the her3 promoter and including the N1 box (Materials and methods). A clear shift in the electrophoretic mobility of the oligonucleotide can be detected. Lanes 4-6 contain 3 µg of Her4 protein, 8000 cpm of the labelled N1 oligonucleotide, and increasing amounts of unlabelled oligonucleotide (1, 2 and 4 pM, respectively). The band shift is competed out. Lanes 7-9 show the same experiment using an oligonucleotide that contains the N2 box (Materials and methods). Binding to the N2 oligonucleotide is weaker. Lanes 10-12 show that, also in this case, binding can be competed with non-radioactive oligonucleotide. Lanes 7-9 and 10-12 contain same amounts of protein and radioactive and non-radioactive DNA as lanes 1-3 and 4-6, respectively. Lanes 13-14 and 15-16 show the effects of mutating either the N1 or the N2 box on the mobility of the labelled probe. Binding to the N1 mutant is still strong. Lanes contain 1 and 5 µg of Her3 protein and 8000 cpm of the labelled oligonucleotides. As a control, lanes 17-20 contain 8000 cpm of the wild-type (17-18) and mutated (19-20) oligonucleotides, without Her4 protein.
EXPRESSION / LABELING:
|


