IMAGE

Fig 6

ID
ZDB-IMAGE-241219-155
Source
Figures for Chakraborty et al., 2024
Image
Figure Caption

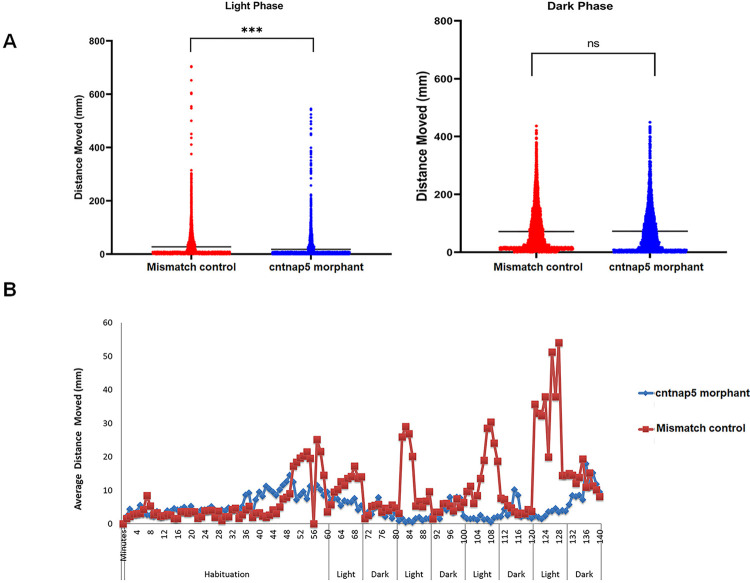
Fig 6 Locomotory movement analysis of zebrafish.

A. Total distance moved (mm) of 96 hpf cntnap5 morpholino injected zebrafish (blue circles) and 96 hpf cntnap5 mismatch control (red circles) zebrafish for the light (left image) and light off (right image) periods. Left image, (light on) p  =  <0.0001, two-sided Mann–Whitney test, n  =  24 cntnap5 morpholino injected zebrafish and n = 24 cntnap5 mismatch control, Right image (light off), p  =  0.5767, bars = mean ± SEM ns not significant, ****p < 0.0001. B. Average distance moved (mm) of 96 hpf cntnap5 morpholino injected zebrafish (blue circles) and 5dpf cntnap5 mismatch control (red circles) zebrafish exposed to four cycles of 10 min light on and 10 min light off after 60-minutes habituation period. Each point represents 1 min, n  =  24 cntnap5 mismatch control zebrafish and n  =  24 cntnap5 morpholino injected zebrafish.

Figure Data
Acknowledgments
This image is the copyrighted work of the attributed author or publisher, and ZFIN has permission only to display this image to its users. Additional permissions should be obtained from the applicable author or publisher of the image. Full text @ PLoS Genet.