IMAGE

Fig 5

ID
ZDB-IMAGE-241219-154
Source
Figures for Chakraborty et al., 2024
Image
Figure Caption

Fig 5

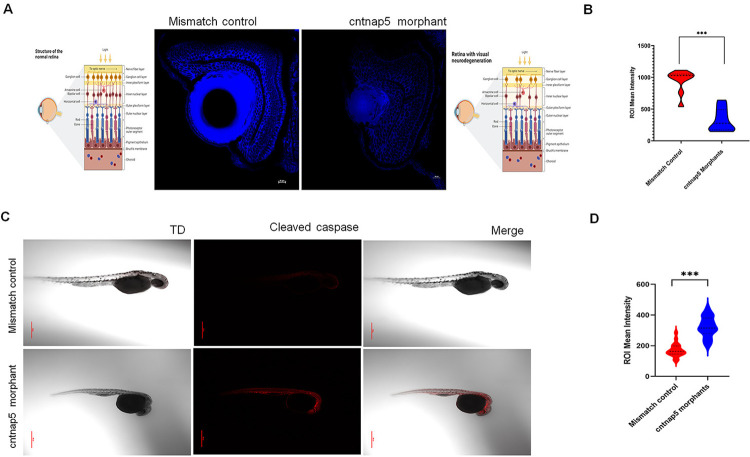
A. Representative eye tissue images of Nissl granules expression of zebrafish embryos (96 hpf) injected with a mismatch control (left) and cntnap5 morpholino (right). Corresponding cartoons are created using BioRender.com licensed version. B. Comparative analysis of eye mean intensity of eye for both groups. bars = mean ± SE, ns not significant, ***p < 0.005. C. Representative whole mount confocal images of cleaved expression of zebrafish embryos (32 hpf) injected with cntnap5 morpholino (upper) or mismatch control (lower) D. Comparative analysis of mean intensity of eye for the both groups, bars = mean ± SE, ns not significant, ***p < 0.005.

Figure Data
Acknowledgments
This image is the copyrighted work of the attributed author or publisher, and ZFIN has permission only to display this image to its users. Additional permissions should be obtained from the applicable author or publisher of the image. Full text @ PLoS Genet.