IMAGE

Figure 8

ID
ZDB-IMAGE-241128-5
Source
Figures for Hedayatikatouli et al., 2024
Image
Figure Caption

Figure 8

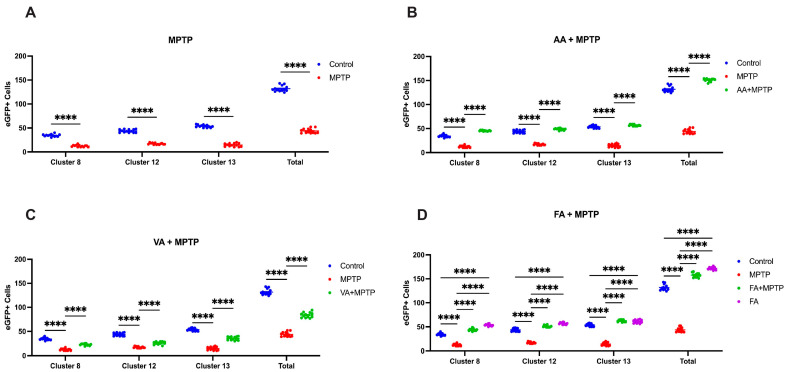
Quantification of DAnergic neurons within the vDC of zebrafish larvae. Developing Tg(dat:eGFP) larvae were exposed to (A) 0.25 mM MPTP, (B) 50 μM ascorbic acid, (C) 250 μM vanillic acid, and (D) 100 μM ferulic acid (n = 10–15) and live imaged using a confocal microscope to capture vDC DAnergic clusters 8, 12, and 13. (A): Two-way ANOVA with Sidak’s multiple comparisons test. (BD): Two-way ANOVA with Tukey’s multiple comparison. **** (p < 0.0001).

Figure Data
Acknowledgments
This image is the copyrighted work of the attributed author or publisher, and ZFIN has permission only to display this image to its users. Additional permissions should be obtained from the applicable author or publisher of the image. Full text @ Biomedicines