
|
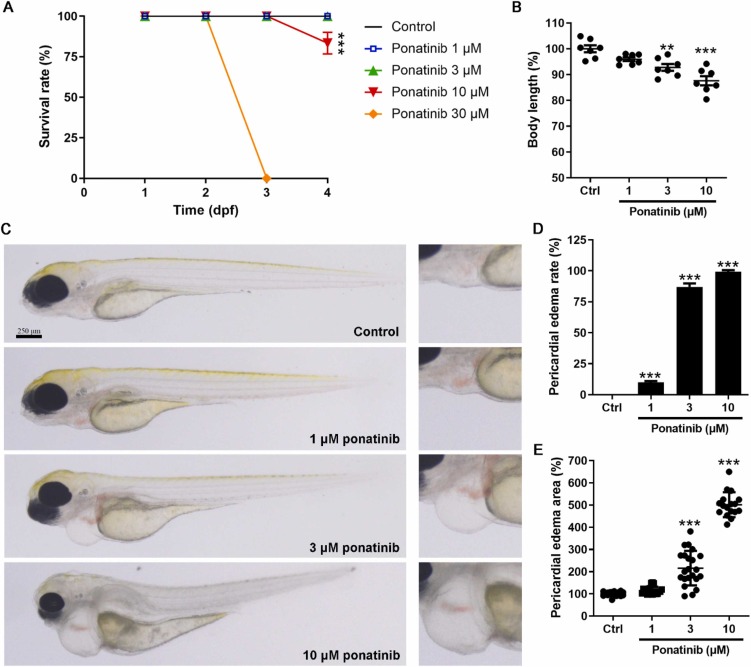
Fig. 1 The effects of Ponatinib on the morphology of zebrafish larvae. (A) Survival curves of 1 dpf zebrafish larvae exposed to indicated concentrations of Ponatinib or 0.1 % DMSO (vehicle control) for 3 days (n=15). (B) Body length of 4 dpf zebrafish (n=7). Data are represented as mean � SEM. **P < 0.01 and ***P < 0.005 vs. control group. (C) Representative images of Ponatinib-induced pericardial edema in 4 dpf zebrafish. (D) The pericardial edema rate in 15 fish/group batches. Data are represented as mean � SEM. ***P < 0.005 vs. control group. (E) The pericardial edema area (n>15). Data are represented as mean � SEM. ***P < 0.005 vs. control group.