IMAGE

Fig. 4.

ID
ZDB-IMAGE-241021-8
Source
Figures for Jukic et al., 2024
Image
Figure Caption

Fig. 4.

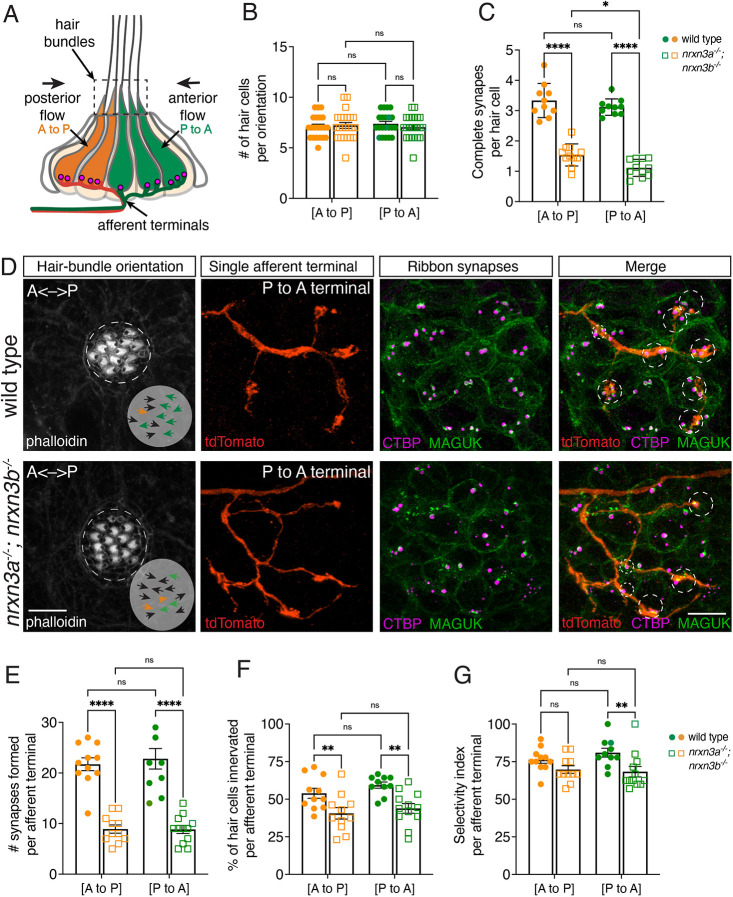
Nrxn3 impacts synapse loss and selectivity to a greater extent in hair cells sensing anterior flow. (A) Primary pLL neuromasts have two populations of hair cells: one responds to anterior flow (green, P to A) and the other responds to posterior flow (orange, A to P). Each population is selectively innervated by distinct afferent neurons (green and orange terminals). (B) Phalloidin label reveals similar numbers of hair cells per neuromast oriented P-to-A and A-to-P flow in wild type and nrxn3a; nrxn3b mutants. n=21 wild-type and 23 nrxn3a; nrxn3b mutant neuromasts at 5 dpf. (C) There are fewer complete synapses in hair cells responding to P-to-A and A-to-P flow in nrxn3a; nrxn3b mutants. There is also a significant reduction in complete synapses in hair cells responding to P to A flow compared with those responding to A to P flow in nrxn3a; nrxn3b mutants. n=10 wild-type and 11 nrxn3a; nrxn3b mutant neuromasts at 5 dpf. (D) Single afferent terminal labeling (P to A fibers) in wild type (top) and an nrxn3a; nrxn3b mutant (bottom). Phalloidin labels hair bundles (orientation indicated by arrows); tdTomato labels individual afferent terminals; CTBP labels presynapses; MAGUK labels postsynapses, and faintly labels hair-cell outlines to provide context. The green and orange arrows in the Phalloidin images indicate the orientation of hair cells that are correctly or incorrectly innervated by each terminal, respectively. The black arrows indicate hair cells that are not innervated by the terminal. In the merged images, large and small circles indicate the synapses and cells that are correctly or incorrectly innervated by each terminal, respectively. (E-G) Quantification shows reduced hair-cell innervation (F) and synapses (E) in both P to A and A to P terminals in nrxn3a; nrxn3b mutants compared with controls. The selectivity of P to A terminals but not A to P fibers is reduced in nrxn3a; nrxn3b mutants compared with controls (G). A two-way ANOVA was used in B,C,E-G. ns, P>0.05; *P<0.05; **P<0.01; ****P<0.0001. Data are mean±s.e.m. Scale bars: 5 µm.

Figure Data
Acknowledgments
This image is the copyrighted work of the attributed author or publisher, and ZFIN has permission only to display this image to its users. Additional permissions should be obtained from the applicable author or publisher of the image. Full text @ Development