IMAGE

Fig. 5.

ID
ZDB-IMAGE-241021-10
Antibodies
Source
Figures for Jukic et al., 2024
Image
Figure Caption

Fig. 5.

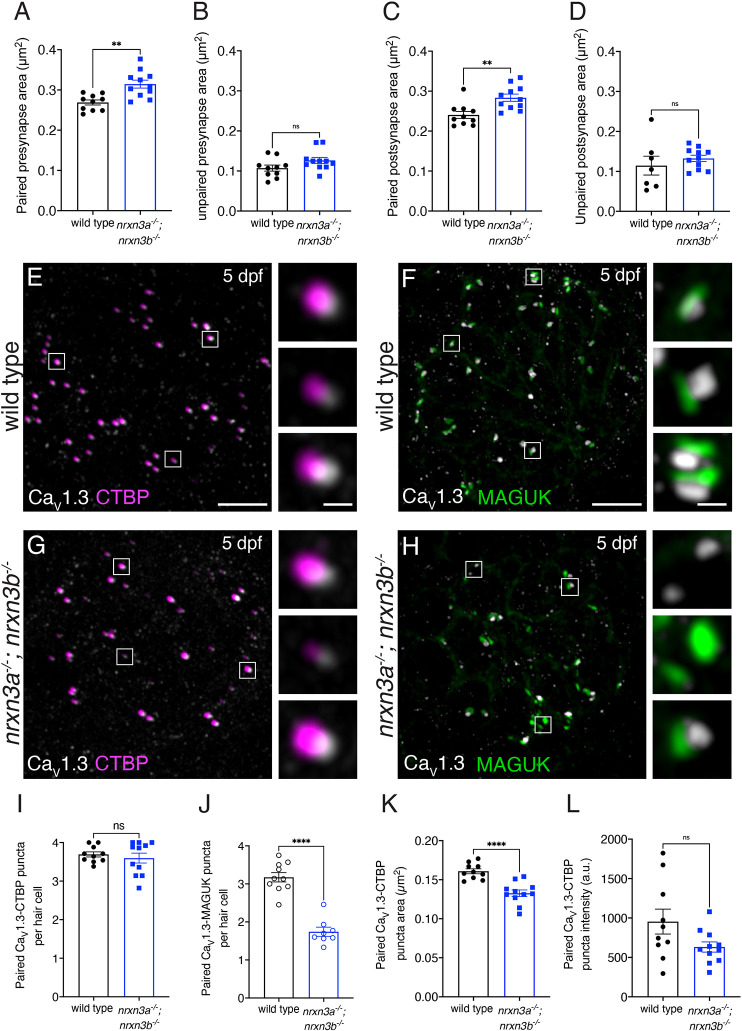
Loss of Nrxn3 impacts pre- and postsynapse size and CaV1.3 channel localization in lateral-line hair cells. (A-D) There is a significant increase in the area of paired (A,C) but not unpaired (B,D) pre- and postsynapses in nrxn3a; nrxn3b mutants compared with wild-type controls. (E-H) Confocal images of mature neuromasts from wild-type controls (E,F) and nrxn3a; nrxn3b mutants (G,H). CTBP labels presynapses with CaV1.3 (E,G) and MAGUK labels postsynapses with CaV1.3 (F,H). The boxed areas (magnified on right) show three examples of individual synapses. Hair cells in A-D were visualized with an Otoferlin or Parvalbumin co-label (not shown). (I-L) Quantification shows no change in the number of CaV1.3-CTBP paired puncta per hair cell in nrxn3a; nrxn3b mutants (I). However, there are significantly fewer CaV1.3-MAGUK paired puncta per hair cell in nrxn3a; nrxn3b mutants (J). The area (K) but not the average intensity (L) of CaV1.3 puncta associated with CTBP puncta is significantly lower in nrxn3a; nrxn3b mutants. n=10 wild-type and 11 nrxn3a; nrxn3b mutant neuromasts in A-D,I,K,L and n=10 wild-type and 8 nrxn3a; nrxn3b mutant neuromasts in J. Images and quantification are from larvae at 5 dpf. An unpaired two-tailed t-test was used in A-D and I-L. ns, P>0.05; **P<0.01; ****P<0.0001. Data are mean±s.e.m. Scale bars: 5 µm (E-H); 1 µm (E-H, insets).

Figure Data
Acknowledgments
This image is the copyrighted work of the attributed author or publisher, and ZFIN has permission only to display this image to its users. Additional permissions should be obtained from the applicable author or publisher of the image. Full text @ Development