IMAGE

Figure 3.

ID
ZDB-IMAGE-240620-242
Source
Figures for Hammond et al., 2024
Image
Figure Caption

Figure 3. 
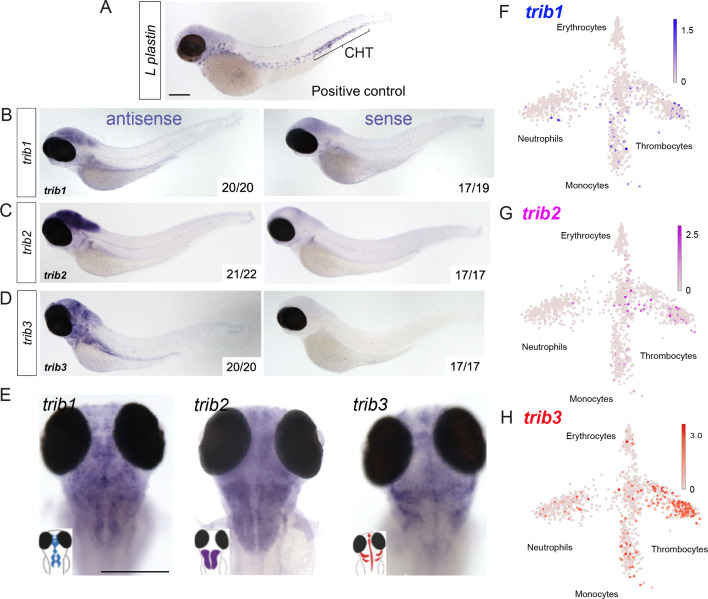
Expression of zebrafish tribbles are located in the brain in larvae and in immune cell subpopulations in adults.

(A) Whole-mount in situ hybridisation of the pan-leukocyte marker L-plastin was used as a positive control to stain leukocytes, present predominantly in the caudal hematopoietic tissue (CHT). Scale bar = 200 µm. (B) Representative images of antisense and sense (control) whole-mount in situ hybridisation of tribbles1. Numbers correspond to number of fish with depictured pattern out of total fish imaged. N = 19–20 fish. (C) Antisense and sense (control) whole-mount in situ hybridisation of tribbles2. N = 17–22 fish. (D) Antisense and sense (control) whole-mount in situ hybridisation of tribbles3. N = 17–20 fish. (E) Magnified dorsal views (×8 magnification) showing distinct expression of each trib isoform in the brain (representative images from each group shown). Scale bar = 200 µm. (F–H) Gene expression of adult zebrafish leukocytes determined using the Zebrafish Blood Atlas (Athanasiadis et al., 2017). Each point represents a separate scRNAseq sample (cell); replicates performed across multiple zebrafish wildtype and transgenic strains. Each arm of schematic indicates a separate blood cell population (labelled). Deeper colour indicates higher expression (log10 scale bars described for each gene).

Acknowledgments
This image is the copyrighted work of the attributed author or publisher, and ZFIN has permission only to display this image to its users. Additional permissions should be obtained from the applicable author or publisher of the image. Full text @ Elife