
|
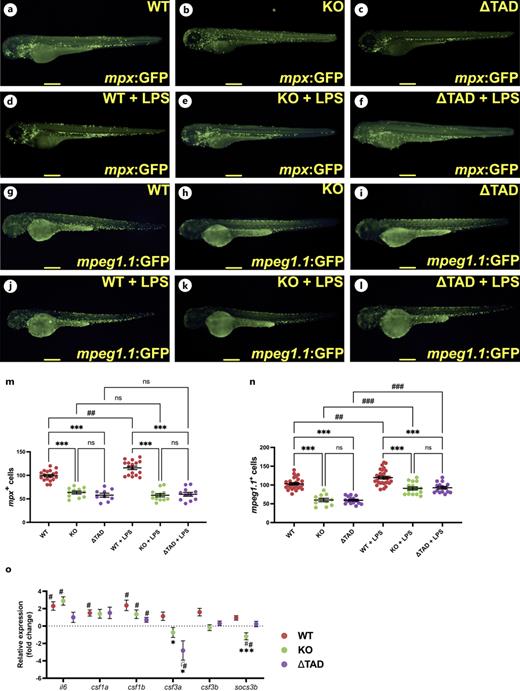
Fig. 5 Effect of Stat3 mutations on the response to LPS. Wild-type (WT: a, d, g, j), knockout (KO: b, e, h, k) and transactivation domain truncation (?TAD: c, f, i, l) mutant 3 dpf embryos on either the Tg(mpx:GFP) (a?f) or Tg(mpeg1.1:GFP) (g-l) transgenic background were left uninjected (a?c, g?i) or subjected to injection with lipopolysaccharide (LPS) (d?f, j?k) and imaged 8 h post injection showing representative images with scale bars of 100 ?m. Quantitation of mpx+ cells (m) and mpeg1.1+ cells (n) showing values for individual embryos. Gene expression analysis of the indicated genes in LPS-injected WT, KO and ?TAD embryos (n = 6) presented as fold-change (log2) relative to uninjected (o). Show mean and SEM with statistical significance indicated between genotypes (m, n) or compared to WT (o) (***p < 0.001, *p < 0.05, ns: not significant), or between uninjected and injected (##p < 0.01, #p < 0.05).