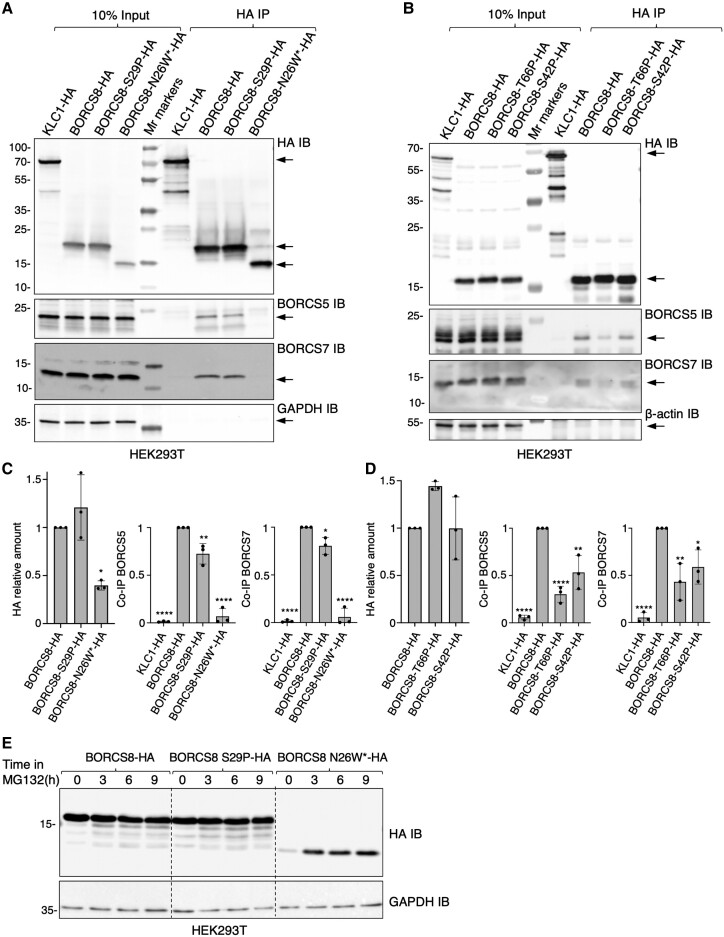
Fig. 4 BORCS8 patient variants reduce the levels and/or assembly of BORC subunits. (A and B) HEK293T cells were transfected with plasmids encoding the indicated HA-tagged constructs and subjected to immunoprecipitation with antibody to the HA epitope. Cell extracts (10%) and immunoprecipitates (HA IP) were analysed by SDS-PAGE and immunoblotting (IB) for the HA epitope, endogenous BORCS5 and BORCS7, GAPDH (control) or ?-actin (control). KLC1-HA was used as a non-specific immunoprecipitation control. The positions of molecular mass markers (in kDa) are indicated on the left. Arrows indicate the positions of the specific proteins. (C and D) Quantification from three independent experiments such as those shown in A and B. Values are the mean ± standard deviation (SD). Statistical significance was calculated by one-way ANOVA followed by multiple comparisons using Dunnett?s test. *P < 0.05; **P < 0.01; ****P < 0.0001. (E) HEK293T cells transfected with HA-tagged BORCS8 constructs were treated with 40 ?M of the proteasomal inhibitor MG132 for the indicated times, lysed and immunoblotted for the HA epitope and GAPDH (loading control). The positions of molecular mass markers (in kDa) are indicated on the left.
Image
Figure Caption
Acknowledgments
This image is the copyrighted work of the attributed author or publisher, and
ZFIN has permission only to display this image to its users.
Additional permissions should be obtained from the applicable author or publisher of the image.
Full text @ Brain

