
|
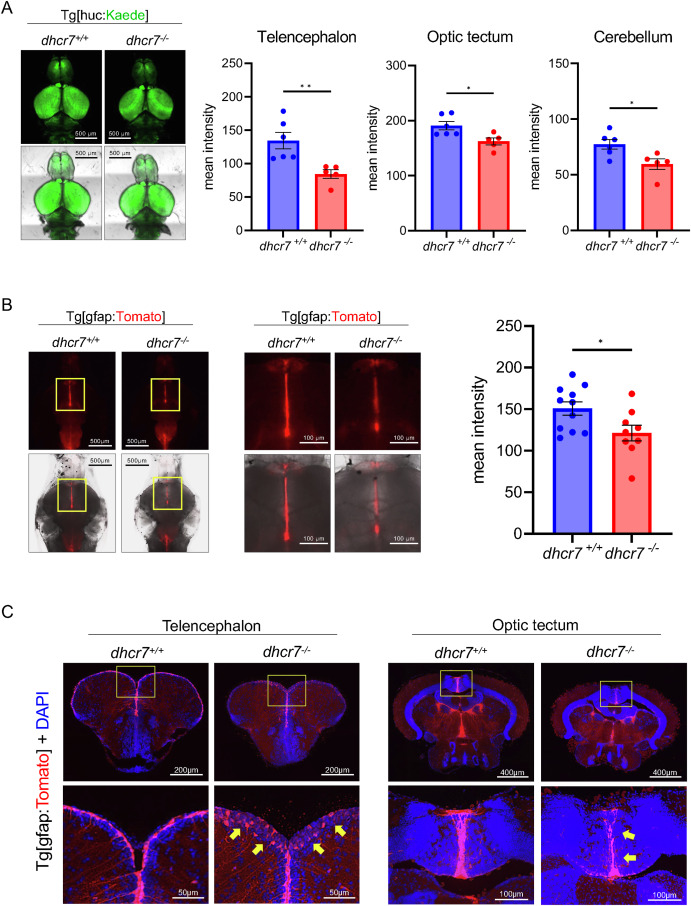
Fig. 2 Decreased neurons and neural stem cells in dhcr7?/? zebrafish (A) Representative images of 1-mpf dhcr7+/+ (n = 6) and dhcr7?/? (n = 5) zebrafish brains in the Tg[huc:Kaede] background. (B) Images of 1-mpf dhcr7+/+ (n = 11) and dhcr7?/? (n = 9) zebrafish brain in the Tg[gfap:Tomato] background. (C) Images of transverse sections of 2-mpf dhcr7+/+ and dhcr7?/? zebrafish brains in the Tg[gfap:Tomato] background (red), stained with DAPI (blue). All values are presented as the mean � SEM. *p < 0.05, **p < 0.01. (For interpretation of the references to colour in this figure legend, the reader is referred to the Web version of this article.)