IMAGE

Figure 2

ID
ZDB-IMAGE-240429-77
Source
Figures for Lachén-Montes et al., 2024
Image
Figure Caption

Figure 2

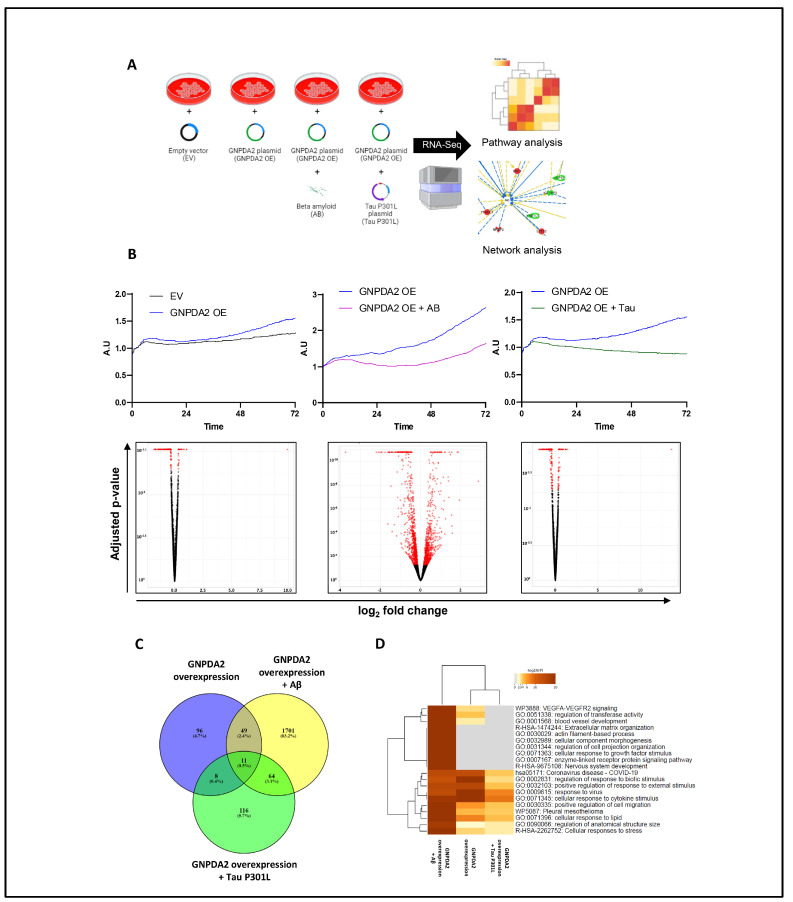
RNA-seq analysis in hNECs. (A) Brief description of experimental design. (B) Cell proliferation monitoring (via an xCELLigence analysis, Agilent, SC, USA) and the corresponding Volcano plots of differentially expressed genes (in red) across biological conditions: effect of GNPDA2 overexpression in hNECs, effect of Aβ treatment after GNPDA2 overexpression in hNECs and effect of Tau P301L treatment after GNPDA2 overexpression in hNECs. (C) Overlap across differential RNA-seq datasets. (D) Top 20 functional analyses across the three biological conditions generated by Metascape.

Acknowledgments
This image is the copyrighted work of the attributed author or publisher, and ZFIN has permission only to display this image to its users. Additional permissions should be obtained from the applicable author or publisher of the image. Full text @ Biomolecules