IMAGE

Figure 2

ID
ZDB-IMAGE-240331-67
Genes
Source
Figures for Habicher et al., 2024
Image
Figure Caption

Figure 2

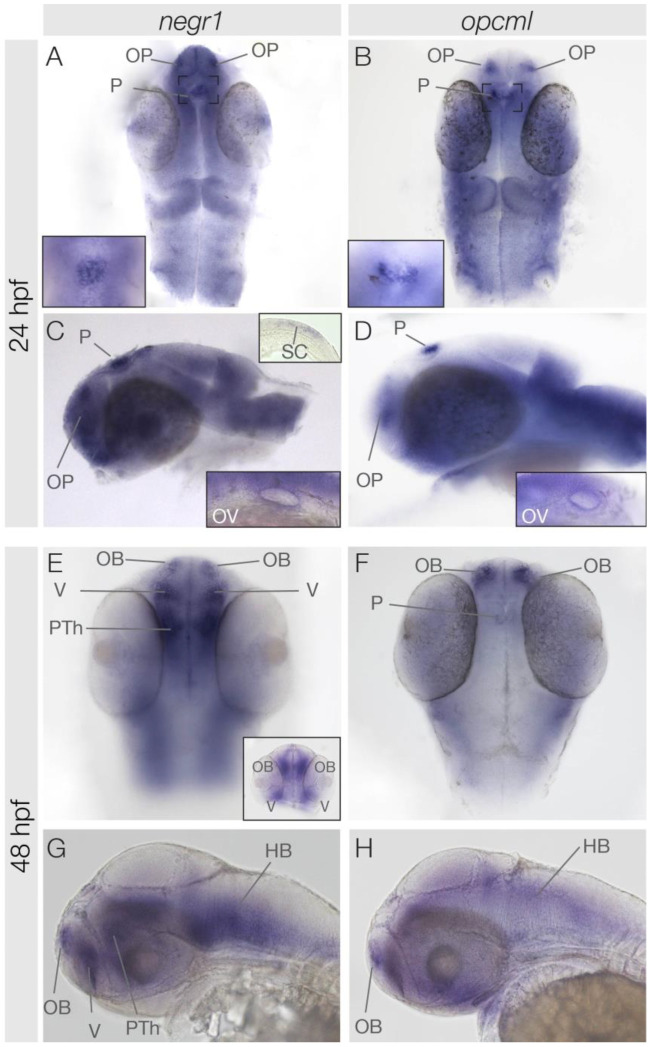
Expression patterns of negr1 and opcml at 24 hpf and 48 hpf. Dorsal (A,B,E,F) and lateral (C,D,G,H) views of the head region of zebrafish embryos at stages indicated. Insets show the pineal gland (A,B), the otic vesicle (C,D), the spinal cord (upper inset in C), and a frontal view (E). HB, hindbrain; OB, olfactory bulb; OP, olfactory placode; OV, otic vesicle; PTh, pre-thalamus; P, pineal gland; SC, spinal cord; V, ventral telencephalon.

Figure Data
Acknowledgments
This image is the copyrighted work of the attributed author or publisher, and ZFIN has permission only to display this image to its users. Additional permissions should be obtained from the applicable author or publisher of the image. Full text @ Genes (Basel)