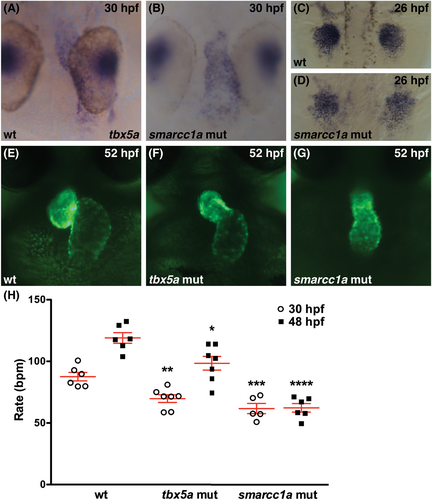
Fig. 10 Loss of tbx5a function is not sufficient to account for the smarcc1a cardiac phenotype. (A?D) Whole-mount in situ hybridization depicts expression of tbx5a in wild-type or smarcc1a mutant embryos. (A, B) Dorsal views at 30 hpf, ventricle to the top. (C, D) Dorsal views at 26 hpf, anterior to the top. Expression of tbx5a appears normal in the heart tube (A, B) and pectoral fin bud mesenchyme (C, D) of smarcc1a mutants, although coalescence and growth of the fin mesenchyme is altered. (E?G) Frontal views of live embryos expressing Tg(myl7:egfp)at 52 hpf. Cardiac chamber shape and looping are more severely affected in smarcc1a mutants (G) than in tbx5a mutants (F). (H) Graph depicts heart rate (beats per minute, bpm) in wild-type, tbx5a mutant, and smarcc1a mutant embryos at 30 and 48 hpf. Mean and SE of each data set are shown. Asterisks in graph indicate statistically significant differences between tbx5a mutant and wild-type heart rates or between smarcc1a mutant and wild-type heart rates at each time point, using an unpaired t-test (*P < .05; **P < .01; ***P < .001; ****P < .0001). Number of hearts analyzed at 30 hpf: wt, n = 6; tbx5a, n = 7; smarcc1a, n = 5. Number of hearts analyzed at 48 hpf: wt, n = 6; tbx5a, n = 7; smarcc1a, n = 6. Heart rate in smarcc1a mutants is significantly lower than in tbx5a mutants at 48 hpf (P < .001, t-test), and the smarcc1a mutant heart rate does not increase between 30 and 48 hpf.
Image
Figure Caption
Figure Data
Acknowledgments
This image is the copyrighted work of the attributed author or publisher, and
ZFIN has permission only to display this image to its users.
Additional permissions should be obtained from the applicable author or publisher of the image.
Full text @ Dev. Dyn.

