IMAGE

Figure 6

ID
ZDB-IMAGE-240226-177
Source
Figures for Raman et al., 2024
Image
Figure Caption

Figure 6

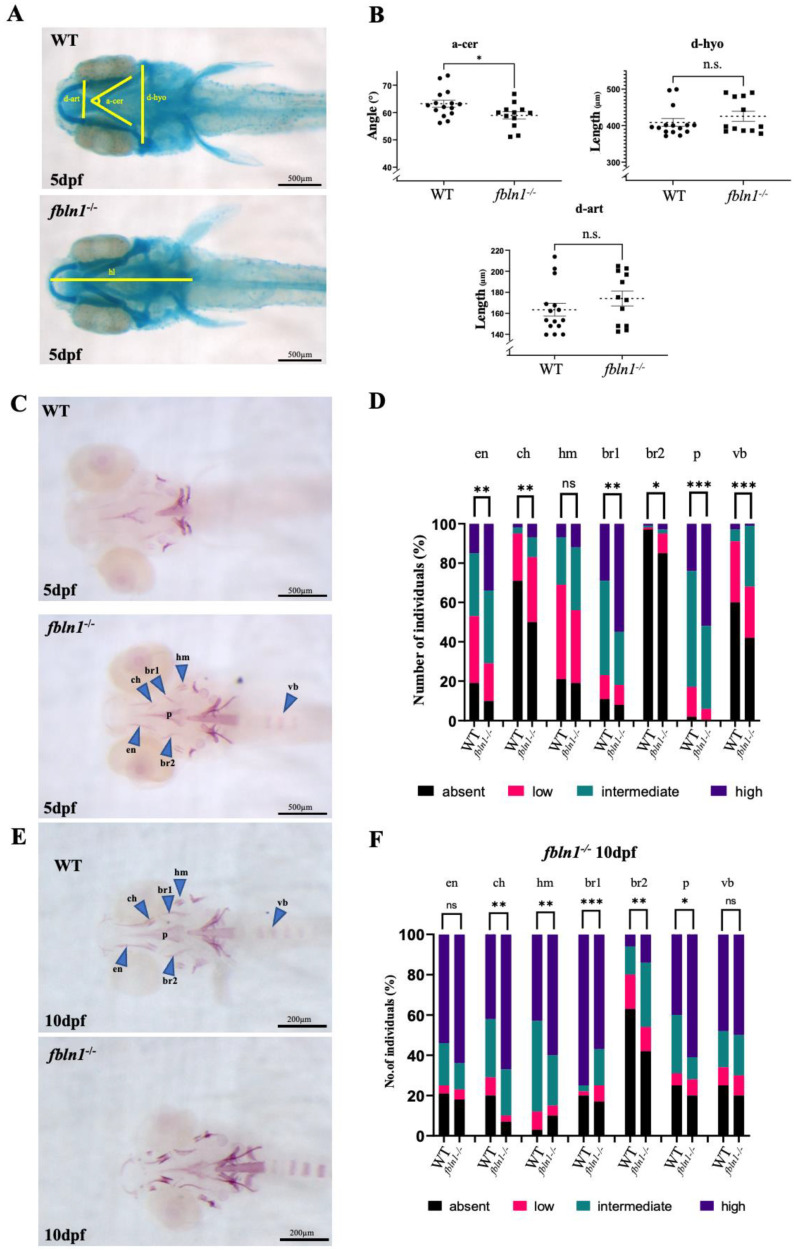
fbln1−/− mutants present increased mineralization at 5 dpf compared to WT. (A) Ventral view of alcian blue stained WT and fbln1−/− larvae at 5 dpf. The distances measured are indicated. (B) fbln1−/− reveal reduced angle between ceratohyals (a-cer) at 5 dpf compared to WT (WT n = 15, fbln1−/− n = 12). (C) Ventral view of alizarin red stained WT and fbln1−/− larvae at 5 dpf. The blue arrowheads point to the skeletal elements: ceratohyal (ch), parasphenoid (p), entopterygoid (en), branchiostegal rays 1 and 2 (br1/br2), hyomandibular (hm), and vertebral body (vb). (D) Fraction (%) of individuals presenting a high (dark blue), intermediate (green), low (red), or absent (black) level of bone mineralization in the different bone elements in WT and fbln1−/− fish at 5 dpf. (WT n = 52, fbln1−/− n = 68). (E) Ventral view of alizarin red stained WT and fbln1−/− larvae at 10 dpf. (F) Fraction (%) of individuals presenting a high (dark blue), intermediate (green), low (red), or absent (black) level of bone mineralization in the different bone elements in WT and fbln1−/− fish at 10 dpf. (WT n = 35, fbln1−/− n = 40). (n.s. = non significant), significance: * p < 0.05, ** p < 0.01, and *** p < 0.001.

Acknowledgments
This image is the copyrighted work of the attributed author or publisher, and ZFIN has permission only to display this image to its users. Additional permissions should be obtained from the applicable author or publisher of the image. Full text @ Biomolecules