IMAGE

Fig. 3.

ID
ZDB-IMAGE-240129-248
Genes
Source
Figures for Olson et al., 2024
Image
Figure Caption

Fig. 3.

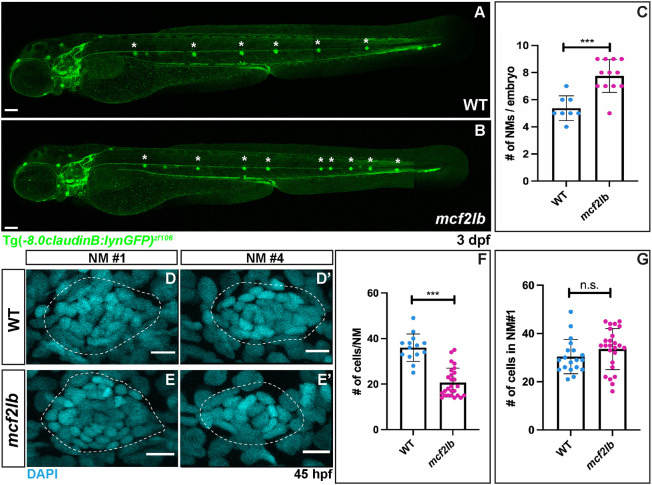
Loss of Mcf2lb leads to the deposition of supernumerary NMs. (A,B) Tg(-8.0claudinB: lynGFP)zf106 marks NMs in WT and mcf2lb mutant embryos at 3 dpf. Note the excess number of deposited trunk NMs in the mcf2lb mutants. Asterisks mark deposited trunk NMs. Full-body images in A were stitched together from four fields of view of individual body segments (head, trunk, tail) using the auto-blend feature in Photoshop. Full-body images in B were stitched together from three fields of view of the head and trunk using the auto-blend feature in Photoshop, and the tail image was manually included. (C) Mean number of NMs in WT (n=8 embryos) and mcf2lb mutant (n=12 embryos) embryos at 3 dpf. (D-E′) DAPI staining of nuclei in deposited NMs in WT (D,D′) and mcf2lb mutants (E,E′). (F) Mean number of cells per NM in WT (n=14 NMs from four embryos) and mcf2lb mutants (n=26 NMs from five embryos). (G) Mean number of cells in the first NM in WT (n=19 NMs) and mcf2lb mutants (n=25 NMs). ***P<0.001 (unpaired two-tailed t-test). n.s., not significant. Error bars are s.d. Scale bars: 100 μm (A,B); 5 μm (D,E).

Figure Data
Acknowledgments
This image is the copyrighted work of the attributed author or publisher, and ZFIN has permission only to display this image to its users. Additional permissions should be obtained from the applicable author or publisher of the image. Full text @ Development