IMAGE

Figure 4

ID
ZDB-IMAGE-240113-35
Genes
Source
Figures for Sobah et al., 2023
Image
Figure Caption

Figure 4

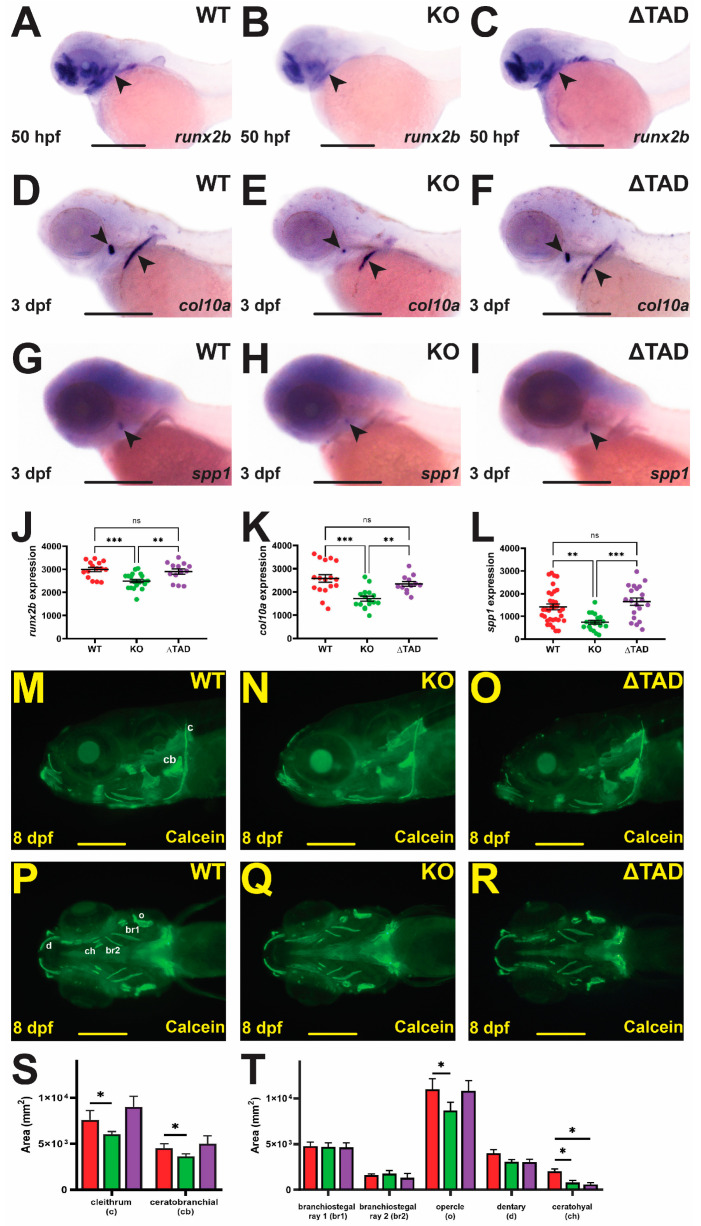
Effect of Stat3 mutations on bone formation. Representative images of Stat3 wildtype (WT: A,D,G,M,P), knockout (KO: B,E,H,N,Q), and transactivation domain truncation (ΔTAD: C,F,I,O,R) mutant embryos subjected to WISH at 50 hpf with runx2b (AC) and at 3 dpf with col10a (DF) or spp1 (GI) in lateral view as indicated with black arrowheads, or at 8 dpf with calcein staining (lateral: MO; ventral: PR), with scale bars representing 200 μm. Quantification of area of staining for runx2b (J), col10a (K), and spp1 (L), showing individual values for each embryo and of specific bones (S,T), with mean, SEM, and statistical significance indicated (*** p < 0.001, ** p < 0.01, * p < 0.05, ns: not significant). Abbreviations: br1/2: branchiostegal ray 1/2; c: cleithrum; cb: ceratobranchial; ch: ceratohyal; d: dentary; o: opercula.

Figure Data
Acknowledgments
This image is the copyrighted work of the attributed author or publisher, and ZFIN has permission only to display this image to its users. Additional permissions should be obtained from the applicable author or publisher of the image. Full text @ Int. J. Mol. Sci.