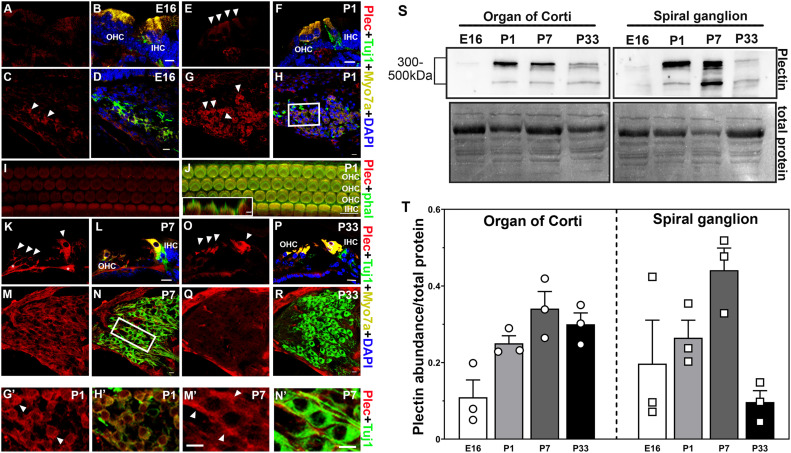
Fig. 5 Spatiotemporal distribution of plectin in mouse inner ear. A-R: Representative images from at least three different animals at each time point. Cochlea cross sections of the organ of Corti at E16 (A-B), P1 (E-F), P7 (K-L) and P33 (O-P). Cochlea cross-sections of the spiral ganglion neurons at E16 (C-D), P1 (G-H, G?-H?), P7 (M-N, M?-N?) and P33 (Q-R). G?-H? and M?-N? correspond to higher magnification images of the framed areas in H and N, respectively. I-J: Whole mount P1 organ of Corti. Insert in J represent a Z-view of the outer hair cell apical structures. Arrowheads denote plectin immunopositive staining. Asterisks in K denote neuronal fiber staining. Plectin (plec, red), myosin 7A (Myo7A, yellow), beta-III tubulin (Tuj1, green), DAPI (blue). Scale bars: A-R, G?-H?, and M?-N?: 10 ?m. Inset in J: 2 ?m. S-T: Immunoblot analysis of the organ of Corti and spiral ganglion at the different developmental time points under study. S: Representative immunoblot. Numbers (left) indicate molecular weight markers. Total protein was used as a loading control. T: Quantification of at least 3 independent experiments. Results are presented as mean +/- SEM. OHC: outer hair cells. IHC: inner hair cells
Reprinted from Hearing Research, 436, Zhang, T., Xu, Z., Zheng, D., Wang, X., He, J., Zhang, L., Zallocchi, M., Novel biallelic variants in the PLEC gene are associated with severe hearing loss, 108831108831, Copyright (2023) with permission from Elsevier. Full text @ Hear. Res.

