IMAGE

Fig. 2.

ID
ZDB-IMAGE-231012-15
Genes
Source
Figures for Harish et al., 2023
Image
Figure Caption

Fig. 2.

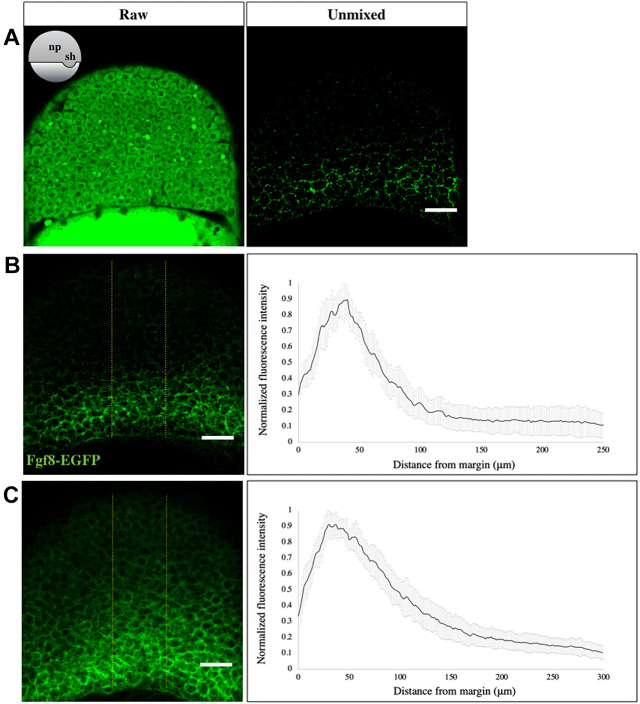
Fgf8a-EGFP forms a gradient during gastrulation. (A) EGFP fluorescence in an optical section of the neural plate in early gastrula stage fgf8a-EGFP embryos, as visualized using the GaAsP detector, before (left) and after (right) linear unmixing. The orientation of embryos is shown schematically in the inset. np, neural plate; sh, shield. (B,C) Sum-intensity z-projected images, derived after linear unmixing (left), used to extract fluorescence intensity profiles in the neural plate (yellow boundaries) at early (B) and mid-gastrula (C) stages. The analysis reveals a graded distribution of Fgf8a towards the animal pole (right). N=15 embryos. Scale bars: 50 μm. Data are mean±s.d.

Figure Data
Acknowledgments
This image is the copyrighted work of the attributed author or publisher, and ZFIN has permission only to display this image to its users. Additional permissions should be obtained from the applicable author or publisher of the image. Full text @ Development