
|
Figure 3
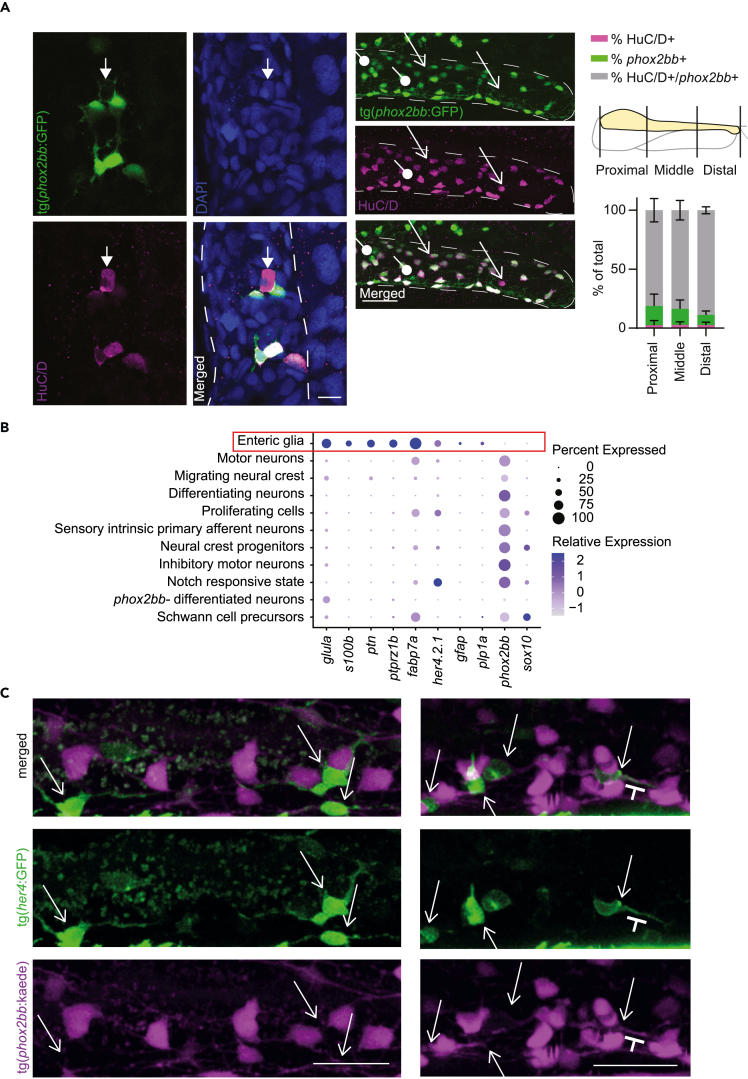
One small cluster expresses genes typical for enteric glia in mammalians
(A) Left: Single plane recording showing a HuC/D+phox2bb-neuron. Scale bar represents 10 μm. Right: Maximum projections of HuC/D antibody staining shows that most HuC/D+ cells in the intestine express phox2bb, but also show phox2bb+/HuC/D-cells (progenitors) depicted by the arrows with a circle end, and phox2bb-;HuC/D+ cells (differentiated neurons) depicted by arrows. Scale bar represents 40 μm. Quantification of the relative amount of double and single positive cells, relative to the total number of enteric neurons (HuC/D only, phox2bb only and double-positives combined)(n=9; 5 dpf, error bars show standard deviation).
(B) Dotplot showing selective expression of some known enteric glia and radial glia markers and lack of expression of
(C) Maximum projections of live-imaging recordings of 5 dpf photoconverted tg(8.3