Image
Figure Caption
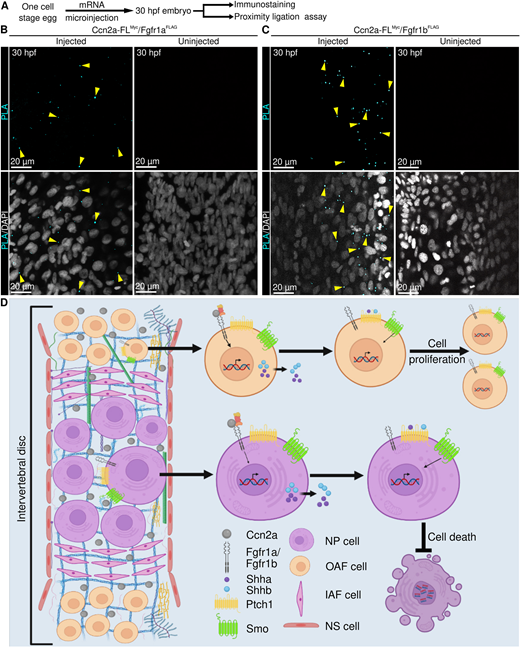
Fig. 7 Ccn2a interacts with Fgfr1a and Fgfr1b in vivo. (A) Schematic of experimental procedures. (B,C) Representative single plane optical sections of whole-mount 30 hpf embryos stained for proximity detection (cyan, interacting complex) and nuclei (white). Arrowheads in B indicate an interaction between C-terminal Myc-tagged Ccn2a and N-terminal FLAG-tagged Fgfr1a (cyan). Arrows in C indicate an interaction between N-terminal Myc-tagged Ccn2a and N-terminal FLAG-tagged Fgfr1b (cyan). (D) Model of the signaling cascade regulated by Ccn2a, which promotes cell proliferation and inhibits cell death.
Acknowledgments
This image is the copyrighted work of the attributed author or publisher, and
ZFIN has permission only to display this image to its users.
Additional permissions should be obtained from the applicable author or publisher of the image.
Full text @ Development

