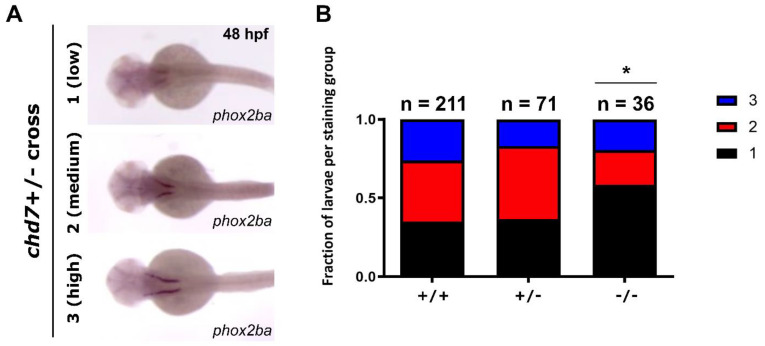
Figure 1
phox2ba expression is reduced in chd7 mutants compared to sibling embryos. (A) Representative images of chd7+/? cross embryos stained for phox2ba at 48 h post?fertilization (hpf) with scored phenotypes. Note that there are variable levels of expression ranging from ?low? = 1, ?medium? = 2, and ?high? = 3. (B) Phenotype fractions bar graph of phox2ba staining in (A). Staining patterns were quantified by scoring based on intensity. The numbers of embryos scored for each genotype are indicated above the graphs. Note the increased proportion of embryos with weak staining patterns in the chd7?/? group. (Chi-square p = 0.0363 (indicated by ?*? above the mutant bar).

