
|
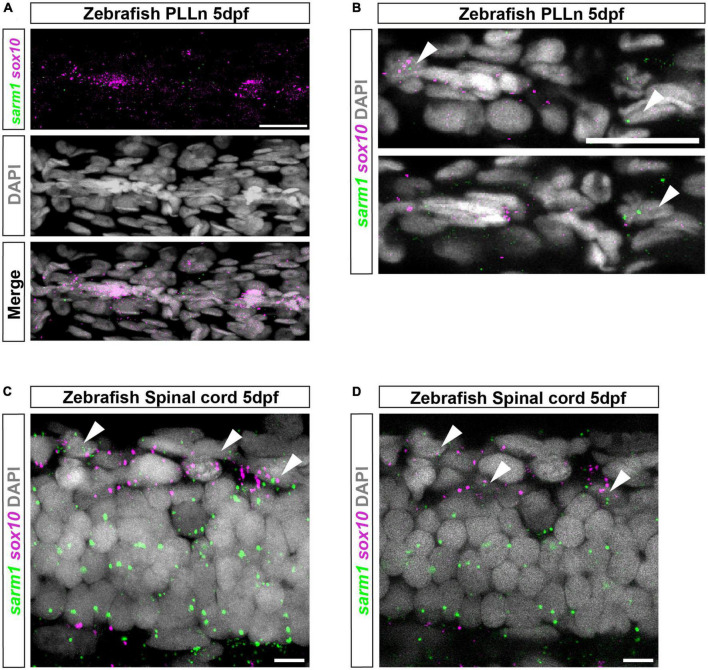
FIGURE 2
sarm1 expression in zebrafish larvae PLLn and spinal cord. (A) MAX projection, lateral view of PLLn of a 5dpf larva demonstrating HCR in situ labeling for sox10 and sarm1 mRNA and DAPI staining to mark nuclei. (B) Single confocal z plane, 616 nm optical thickness, lateral view of PLLn of a 5dpf larva. Arrowheads mark nuclei, labeled with DAPI, positive for sox10 and sarm1 mRNA. In the PLLn, 22.4% ± 3.161 [mean and standard error of mean (SEM), n = 5 larvae, 5 sections per larvae] of sox10 positive cells also expressed sarm1. (C) MAX projection, lateral view of spinal cord of a 5dpf larva demonstrating HCR in situ labeling for sox10 and sarm1 mRNA and DAPI staining to mark nuclei. Arrowheads mark nuclei positive for sox10 and sarm1 mRNA. (D) Single confocal z plane, 475 nm optical thickness, lateral view of spinal cord of a 5dpf larva. Arrowheads mark nuclei positive for sox10 and sarm1 mRNA. In the spinal cord, 60.3% ± 2.4 (mean and SEM, n = 5 larvae, 3 sections quantified per larvae) of sox10 positive cells also expressed sarm1. For all images: sox10 mRNA (magenta) and sarm1 mRNA (green), nuclei labeled with DAPI (gray), scale bar 25 μm.