
|
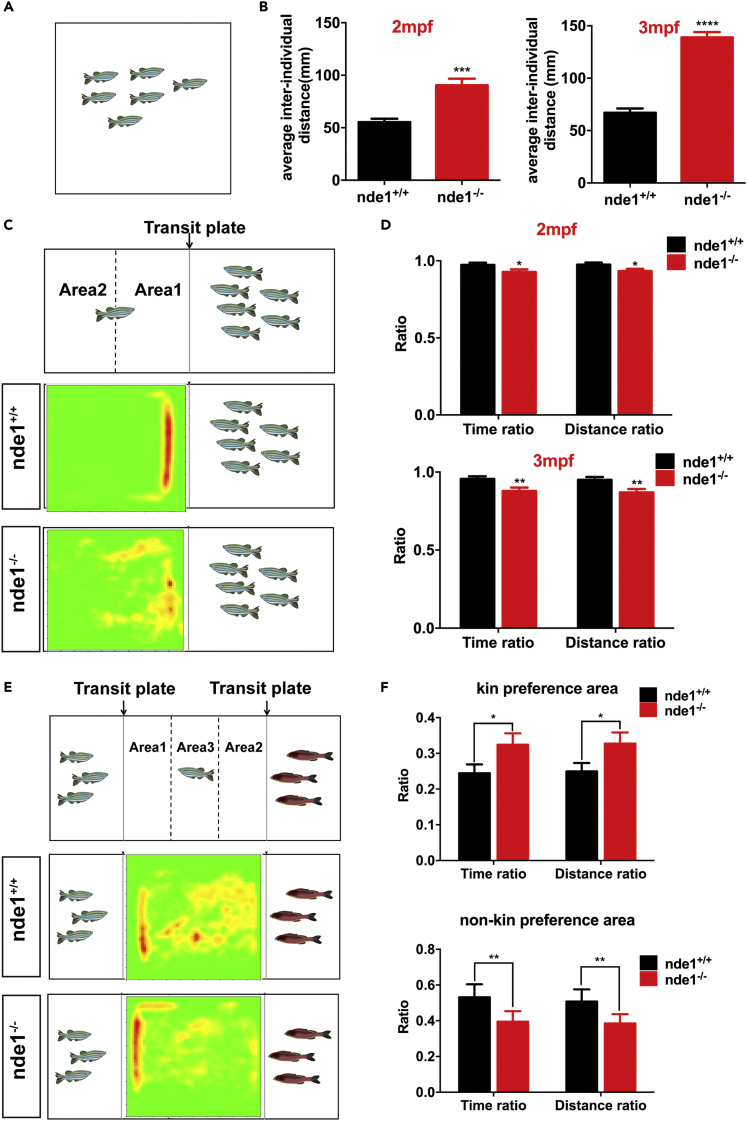
Fig. 4
Social behavior analysis of nde1?/? zebrafish
(A) Schematic of shoaling test.
(B) Significantly increased inter-fish distance of 2 mpf (n = 10) and 3 mpf (n = 10) nde1?/? zebrafish.
(C) Schematic and representative heatmap of social preference test; area1: social area, area2: nonsocial area.
(D) Time ratio and distance ratio in the social area were significantly reduced in 2 mpf (n = 35) and 3 mpf (n = 28) nde1?/? zebrafish compared with nde1+/+ zebrafish.
(E) Schematic and representative heatmap of kin recognition and preference test; area1: kin preference area, area2: nonkin preference area.
(F) Significantly increased ratio of kin preference area entering and decreased ratio of nonkin preference area entering in 3 mpf nde1?/? zebrafish (n = 28).
Data are presented as mean � SEM; ?p < 0.05, ??p < 0.01, ???p < 0.001, ????p < 0.0001