
|
Fig. 3
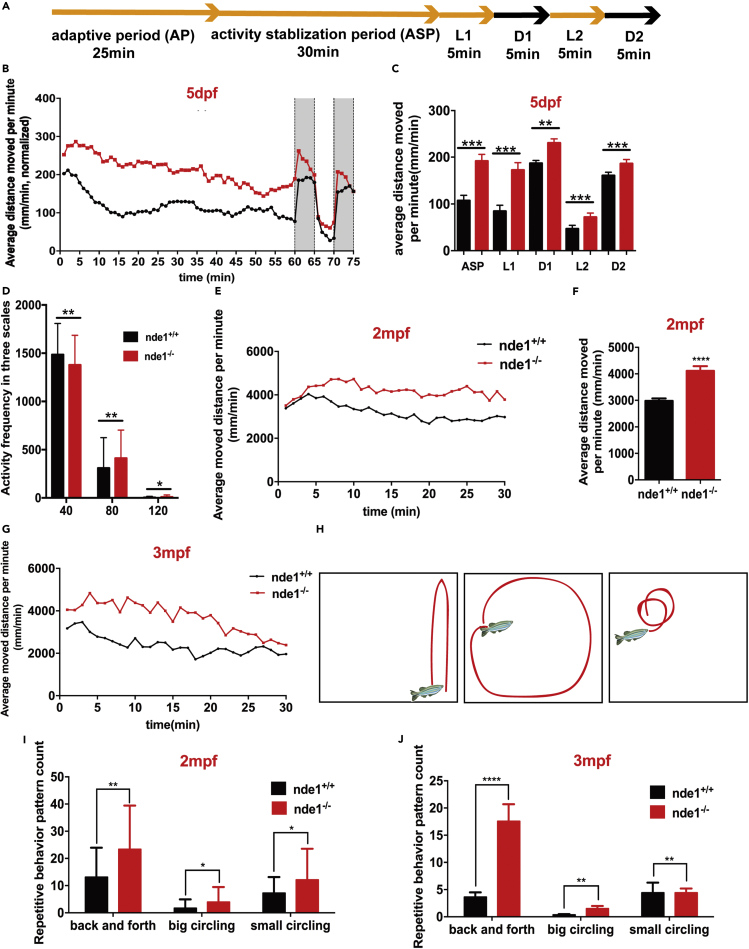
Zebrafish locomotor activity at 5 dpf, 2 mpf, and 3 mpf
(A) Experimental setup of analysis of 5 dpf locomotor activity.
(B) nde1+/+ and nde1?/? larvae (5 dpf) movement trend line graph within 75 min of the experiment time (n = 36).
(C) Comparison of locomotor activity between nde1 nde1+/+ and nde1?/? larvae (5 dpf).
(D) Activity frequency of ASP at three intensity scales.
(E and G) 2 mpf (E, n = 32) and 3 mpf (G, n = 28) nde1+/+ and nde1?/? zebrafish movement trend graph within 30 min of the experiment time.
(F) Comparison of 20 min ASP of locomotor activity of two mpf nde1+/+ and nde1?/? zebrafish.
(H) Representative trace of back and forth, big circling and small circling of nde1?/? zebrafish.
(I and J) 2 mpf (I) and three mpf (J) nde1?/? zebrafish showed more repetitive behaviors than nde1+/+.
Data are shown as mean � SEM; ?p < 0.05, ??p < 0.01, ???p < 0.001, ????p < 0.0001.