
|
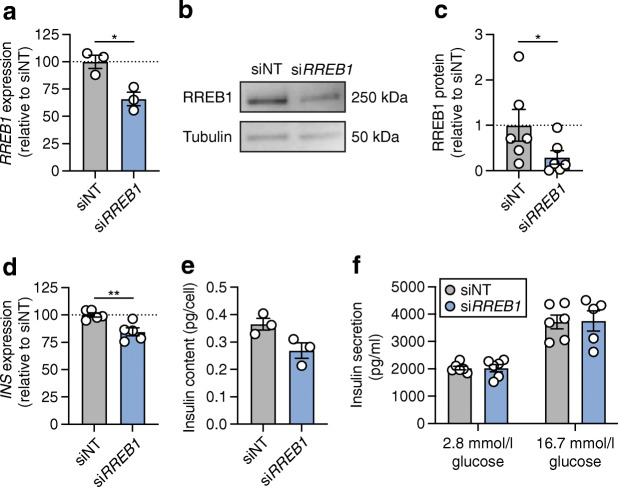
Fig. 3
Partial loss of RREB1 reduces cellular insulin content in mature beta cells. (a) RREB1 gene expression (normalised to the housekeeping genes TBP and PPIA and expressed as % of siNT) in siNT control and siRREB1 knockdown EndoC-?H1 cells (n=3). (b) Representative western blot of RREB1 (250 kDa) and tubulin (50 kDa) in siNT and siRREB1 EndoC-?H1 cells. (c) Quantification of RREB1 protein expression following siRNA knockdown in EndoC-?H1 cells (n=6). (d) INS gene expression (normalised to the housekeeping genes TBP and PPIA and expressed as % of siNT) in siNT and siRREB1 EndoC-?H1 cells (n=5). (e) Cellular insulin content (pg/cell) (n=5) and (f) glucose-stimulated insulin secretion (pg/ml) (n=6; n=5 for siRREB1 16.7 mmol/l glucose) measured in siNT and siRREB1 EndoC-?H1 cells. Data are presented as means�SEM. *p<0.05, **p<0.01 (unpaired t test)