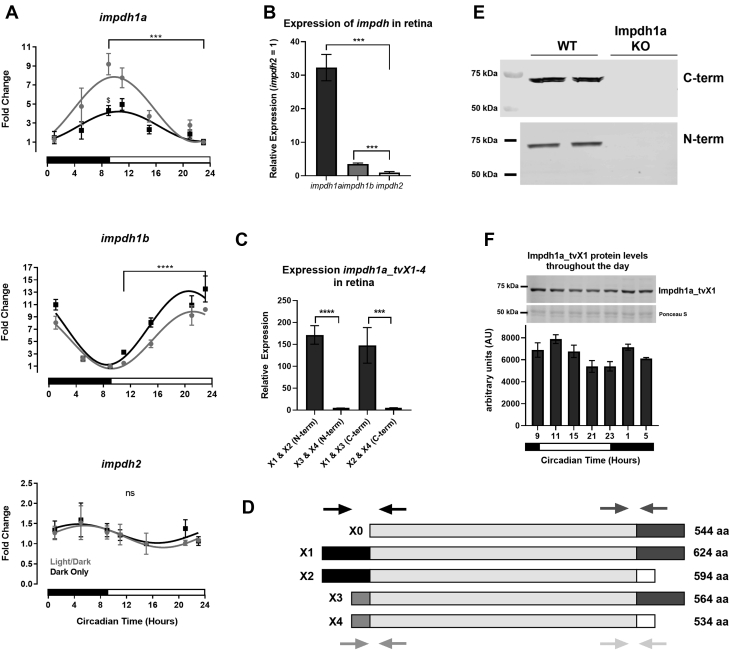
Fig. 1
Impdh1a_tv1a is the predominant variant in the retina.A, relative expression levels of all transcript variants for impdh1a, 1b, and 2 throughout the day. For each graph, minimum expression = 1: impdh1a timepoints measured relative to 23:00, impdh1b relative to 9:00, and impdh2 relative to 15:00. The black and white bars indicate lights on (9:00) and lights out (23:00) for animals under normal light/dark cycle, $ denotes p ? 0.05 normal light/dark compared with dark only at 9:00. B, comparison of relative maximum expression levels of impdh1a (9:00), 1b (23:00), and 2 (5:00) transcripts. C, comparison of relative expression levels for all impdh1a transcripts detected in the retina at 9:00. N = 6 animals, the samples were in triplicate. D, schematic of impdh1a transcripts X1 to X4 and 544 (X0, NM_001002177.1); primer location for (C) indicated by arrows for both C-terminal and N-terminal reactions. See Table 1 for primer/transcript information. E, Western blot of Impdh1a protein in WT and impdh1a23234 zebrafish retinas using antibodies that recognize either X1 and X3 (C-terminal) or X1 and X2 (N-terminal) N = 2. F, quantification of Impdh1a_tvX1 protein levels throughout the day using the C-terminal antibody, and inset shows representative Western blot with Ponceau S used as a loading control. Trend p =0.04, N = 2 animals per time point. N = 3 animals per time/data point for all other panels except where noted. impdh, inosine monophosphate dehydrogenase; tv, transcript variant. ns p > 0.05, ? p ? 0.05 , ?? p ? 0.01, ??? p ? 0.001, ???? p ? 0.0001.

