Figure 2
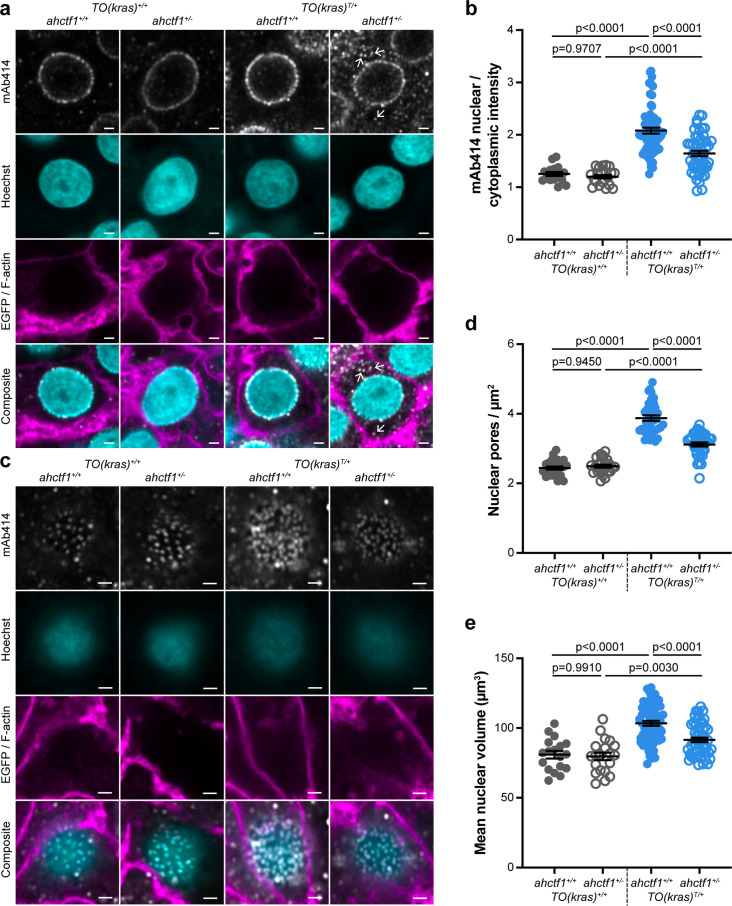
(a) Representative Airyscan imaging of liver sections stained with mAb414 (white) marking FG-NUPs, Hoechst 33342 (cyan) marking DNA, and rhodamine phalloidin (magenta) marking the F-actin cytoskeleton in non-TO(krasG12V)-expressing cells and EGFP-KrasG12V (magenta) marking the cell membrane in dox-treated TO(krasG12V)-expressing cells of the indicated ahctf1 and TO(krasG12V) genotypes. Arrows in right-hand panel point to mAb414/FG-nucleoporin staining in the cytoplasm. Scale bar 2 Ám. (b) Quantification of mean nuclear/cytoplasmic fluorescence intensity of mAb414 staining after 3D segmentation and morphological filtering of nuclear and cytoplasmic areas (n > 18). (c) Representative Airyscan images of mAb414 staining at the nuclear surface of sections of the indicated ahctf1 and TO(krasG12V) genotype. Scale bar 1 Ám. (d) Quantification of nuclear pore density (n ? 25). (e) Quantification of nuclear volume (n ? 25). Data are expressed as mean ▒ standard error of the mean (SEM). Significance was assessed using a one-way analysis of variation (ANOVA) with Tukey?s multiple comparisons test.
ahctf1 heterozygosity disrupts the density of nuclear pore complexes and reduces nuclear volume in dox-treated TO(krasG12V)T/+ hepatocytes.
Image
Figure Caption
Figure Data
Acknowledgments
This image is the copyrighted work of the attributed author or publisher, and
ZFIN has permission only to display this image to its users.
Additional permissions should be obtained from the applicable author or publisher of the image.
Full text @ Elife

