
|
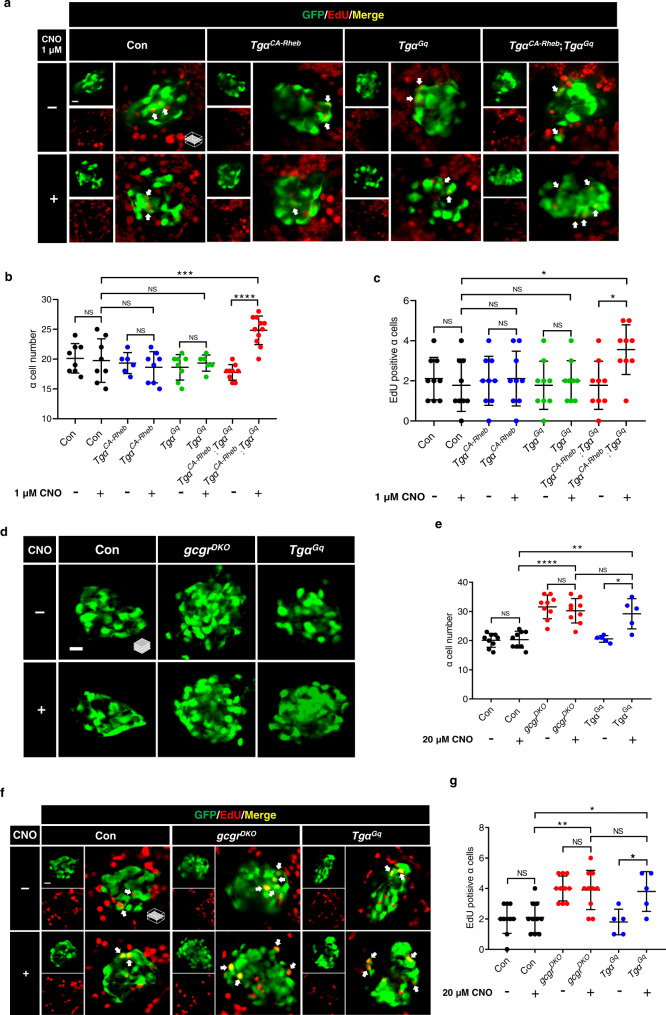
Fig. 6
a Representative images of EdU staining in control, Tg?CA-Rheb, Tg?Gq, and Tg?CA-Rheb;Tg?Gq larvae treated with 1 ?M CNO or vehicle for 48 h at 5 dpf. EdU (red)-positive ? cells are indicated by arrows (scale bar, 10 ?m). b Quantification of ? cell numbers in control, Tg?CA-Rheb, Tg?Gq, and Tg?CA-Rheb;Tg?Gq larvae treated with 1 ?M CNO or vehicle for 48 h at 5 dpf. (data represent the means � SD, n = 8, 8, 6, 8, 8, 6, 9, and 11 for each group, respectively). c Quantification of EdU-positive ? cell numbers in control, Tg?CA-Rheb, Tg?Gq, and Tg?CA-Rheb;Tg?Gq larvae treated with 1 ?M CNO or vehicle for 48 h at 5 dpf (data represent the means � SD, n = 9 for each group). d Representative images of ? cells in control, gcgrDKO, and Tg?Gq larvae treated with 20 ?M CNO or vehicle for 48 h at 5 dpf (scale bar, 10 ?m). e Quantification of ? cell numbers in control, gcgrDKO and Tg?Gq larvae treated with 20 ?M CNO or vehicle for 48 h at 5 dpf (data represent the means � SD, n = 9, 9, 9, 9, 5, and 5 for each group, respectively). f Representative images of EdU staining in control, gcgrDKO and Tg?Gq larvae treated with 20 ?M CNO or vehicle for 48 h at 5 dpf. EdU (red)-positive ? cells are indicated by arrows (scale bar, 10 ?m). g Quantification of EdU-positive ? cell numbers in control, gcgrDKO and Tg?Gq larvae treated with 20 ?M CNO or vehicle for 48 h at 5 dpf (data represent the means � SD, n = 10, 10, 10, 10, 5, and 5 for each group, respectively). *P < 0.05, **P < 0.01, ***P < 0.001, ****P < 0.0001, NS indicates no significant difference (one-way ANOVA, Tukey?s multiple comparisons test, the quantifications represent individual islet sections). Source data are provided as a Source Data file.