Figure 6
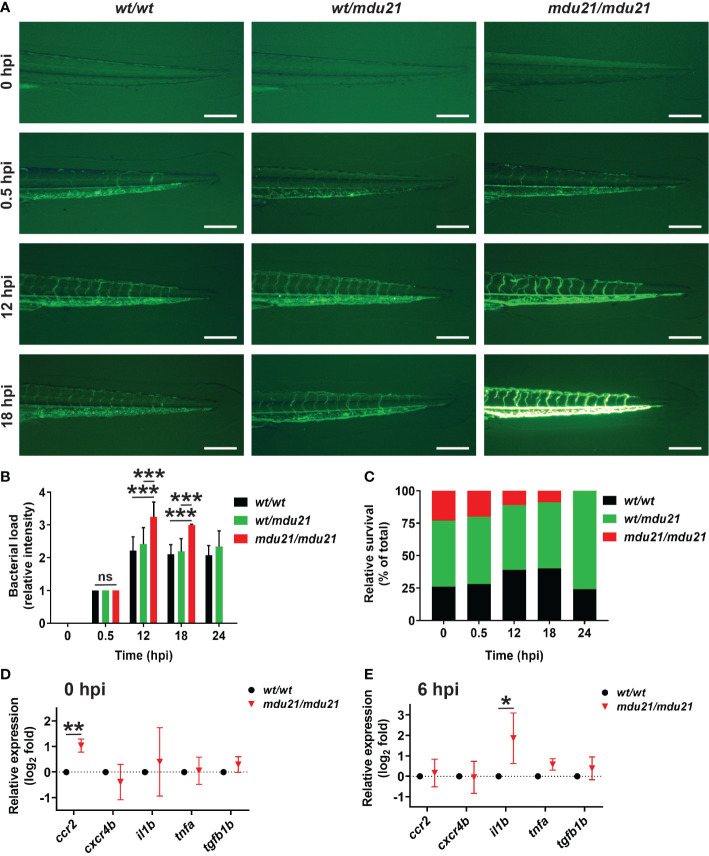
Figure 6 Analysis of bacterial infection in bcl6aa mutant zebrafish. (A) Infection of 4 dpf embryos with GFP+ E coli showing representative bcl6aawt/wt (wt/wt), bcl6aawt/mdu21 (wt/mdu21) and bcl6aamdu21/mdu21 (mdu21/mdu21) embryos at the indicated timepoints. Scale bars represent 200 μm. (B) Bacterial load intensity was assessed on a 5 point scale (0-4) for bcl6aawt/wt (wt/wt), bcl6aawt/mdu21 (wt/mdu21) and bcl6aamdu21/mdu21 (mdu21/mdu21) embryos at each timepoint relative to 0.5 hpf being 1, showing mean ± SEM (***p<0.001; ns: not significant; n≥50 total at each timepoint). (C) Relative survival of bcl6aawt/wt (wt/wt), bcl6aawt/mdu21 (wt/mdu21) and bcl6aamdu21/mdu21 (mdu21/mdu21) embryos at the indicated timepoints (n=100 total at each timepoint). (D, E) Analysis of the indicated inflammatory gene markers in homozygous bcl6aawt/wt (wt/wt) and bcl6aamdu21/mdu21 (mdu21/mdu21) individuals at 0 hpi (D) and 6 hpi (E) using qRT2-PCR with data normalized relative to actb and represented as relative fold change compared to wild-type, with mean and SD shown and statistical significance indicated (*p<0.05, **p<0.01, n=4).

