
|
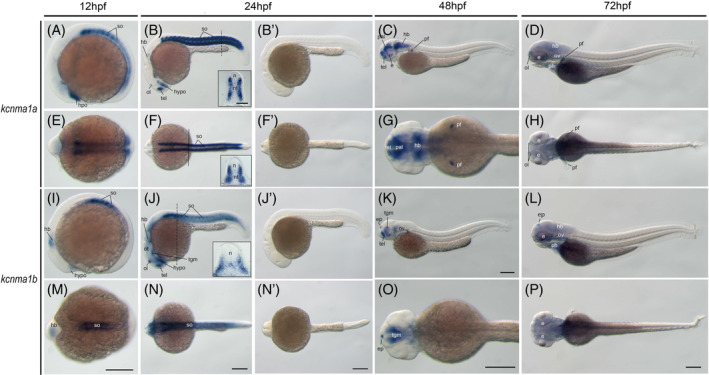
Fig. 5
The kcnma1 genes (BK) during zebrafish early embryogenesis. Whole?mount in situ hybridization of zebrafish embryos at stages 12hpf (A,E,I,M), 24hpf (B,F,J,N,B?,F?,J?,N?), 48hpf (C, G, K, O), and 72hpf (D, H, L, P). Sense riboprobe controls (B?,F?,J?,N?) do not show any specific staining at 24hpf. Anterior is to the left in all the whole?mount images, and dorsal is to the top in all transverse sections. The dashed lines indicate the positions of sections. The section images were shown in the insert of corresponding panels. A?D, Lateral view of gene expression of kcnma1a. E?H, Dorsal view of gene expression of kcnma1a. I?L, Lateral view of gene expression of kcnma1b. M?P, Dorsal view of gene expression of kcnma1b. Scale bars are added on the bottom row of images; 250 ?m for whole?mount images and 50 ?m for tissue sections. e, eye; ep, epiphysis; hb, hindbrain; hypo, hypothalamus; n, neural tube; nt, notochord; ol, olfactory placodes/organ; op, optic vesicle; ot, optic tectum; ov, otic vesicle; pal, pallium; pf, pectoral fin; ph, pharyngeal arches; so, somite; tb, tailbud; tel, telencephalon; tgm, tegmentum