
|
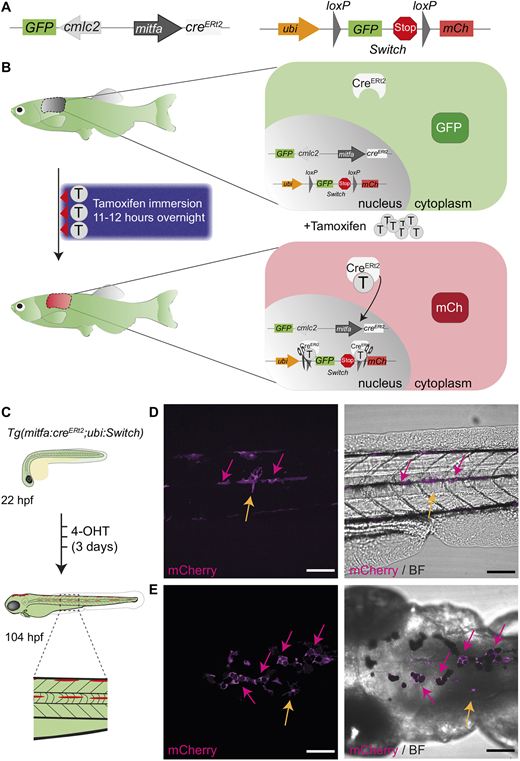
Fig. 1
A tamoxifen-inducible mitfa:creERt2/loxP system in zebrafish labels melanocytes. (A) A schematic of mitfa:creERt2 (left) and ubi:Switch (right) (Mosimann et al., 2011) constructs to enable a green-to-red switch in mitfa promoter-expressing cells after tamoxifen treatment. The cardiac myosin light chain 2 (cmlc2; also referred to as myl7) promoter drives GFP expression and facilitates screening for the creERt2 line based on GFP+ heart myocardium. mCh, mCherry. (B) A schematic of the concept behind the colour-switching creERt2/loxP system that allows green-to-red switch after tamoxifen (T) treatment in cells expressing the mitfa promoter driving creERt2. (Left) A three-night course of treatment with tamoxifen for 11-12 h by immersion in the dark with a drug-free period during the day. (Right) The principle of colour switching upon tamoxifen treatment as a result of CreERt2 trans-localisation to the nucleus, causing excision of GFP and a stop codon, enabling mCherry expression in recombined cells. (C) An illustration of the expected green-to-red fluorophore switch in the zebrafish embryo upon three consecutive daily treatments with 20 �M 4-hydroxytamoxifen (4-OHT). Enlarged view of dashed line rectangle shows ?switched? melanocytes in the embryonic stripes. hpf, h post fertilisation. (D,E) Lateral (D) and dorsal (E) views of a zebrafish larva after 4-OHT treatment at 104 hpf (4.5 dpf) validates mitfa:creERt2 specificity to melanocyte lineage. Standard deviation intensity (STD) projection of a confocal z-stack (left, mCherry) and merged with a single z-plane acquisition in brightfield (BF) channel (right, merge) at 6 h after the end of 4-OHT treatment. mCherry-expressing melanocytes are visible and express black melanin pigment (pink arrows). Two unpigmented, star shaped cells expressing mCherry are also visible and may represent xanthophore progenitors (yellow arrows). N=6 fish for each view, scale bars: 100 �m.