
Fig. 6
|
Fig. 6
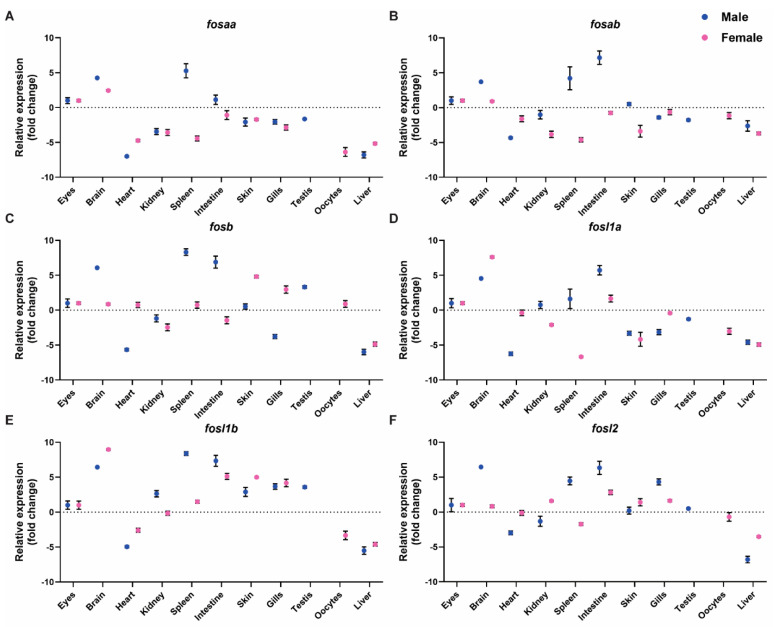
Relative expression of fos genes in male and female zebrafish adult tissues. mRNA expression levels of fosaa (A), fosab (B), fosb (C), fosl1a (D), fosl1b (E), and fosl2 (F) in zebrafish adult male tissues eyes, brain, heart, kidney, spleen, intestine, skin, gills, testis, and liver were determined by qRT-PCR. The relative mRNA levels were normalised to actb and ddct values determined by comparison with expression in the male eyes, the tissue with moderate expression. The black error bars indicate the standard error of mean for four biological replicates and the dotted line indicates the median in a tissue showing moderate expression.