IMAGE

Fig. 2

ID
ZDB-IMAGE-220901-15
Source
Figures for Liu et al., 2022
Image
Figure Caption

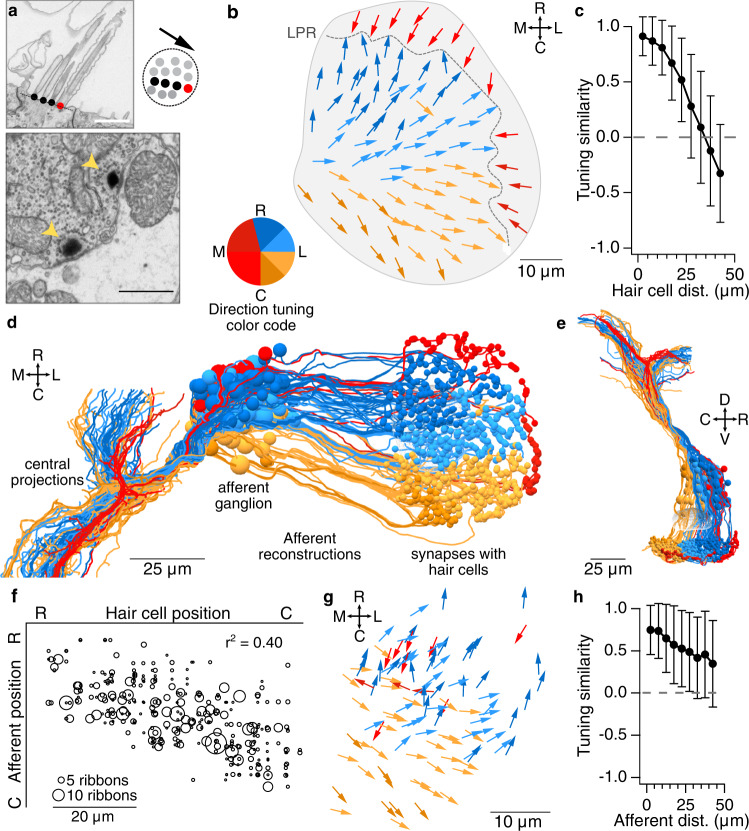
Fig. 2 The utricular afferent ganglion is organized in the rostrocaudal axis by directional tuning.

a Top, Electron micrograph of utricular hair cell with stereocilia (black) and kinocilium (red) marked. Right, schematic of tuning vector derived from cilia positions, viewed from above. Bottom, EM image of hair cell synaptic ribbons (arrowheads) apposed to a utricular afferent. Scale bars, 1 µm. b Horizontal projection of the utricular macula, showing tuning direction vectors for all 91 hair cells. Dashed line: line of polarity reversal (LPR). Vectors are colorized by directional tuning. Note slight asymmetry in colorization; this was chosen to ensure hair cells from the medial and lateral sides of the LPR are represented in different colors. Here and throughout: R, C = rostral, caudal = nose-down and nose-up pitch, respectively. M, L = medial, lateral = contralateral and ipsilateral roll, respectively. Source data for this and all graphs is provided in the Source Data file. c Hair cells located near each other have more similar directional tuning, which falls off sharply within ~30 µm. Data from hair cells medial to the LPR only (n = 77 hair cells) and represent mean values ± SD. d Horizontal view of reconstructions of all 105 utricular ganglion afferents including somata (larger spheres, left) and their postsynaptic contacts in the utricular macula (smaller spheres, right). Afferents are colorized by inferred direction tuning as in b. View is slightly tilted to aid in visualization of ganglion. Afferents with inferred contralateral head tilt tuning (red) form a segregated axon bundle in the brainstem (left). e Sagittal view of reconstructions shown in d. f Correlation of rostrocaudal soma position between synaptically connected utricular hair cells and afferents. Circle size reflects the number of synaptic ribbon connections (range: 1–19). Significance of linear correlation, t-test, p = 1.3 × 10−102. g Horizontal projection of inferred afferent tuning vectors, relative to soma position in the afferent ganglion. Each vector indicates an afferent’s tuning direction, calculated by weighting by the number of ribbon inputs it receives from each hair cell. Colors as in b. h Afferents located close to each other have similar directional tuning, but the relationship is looser than in hair cells (c). Data are from afferents innervating the macula medial to the LPR only (n = 94 afferents) and represent mean values ± SD.

Acknowledgments
This image is the copyrighted work of the attributed author or publisher, and ZFIN has permission only to display this image to its users. Additional permissions should be obtained from the applicable author or publisher of the image. Full text @ Nat. Commun.