
|
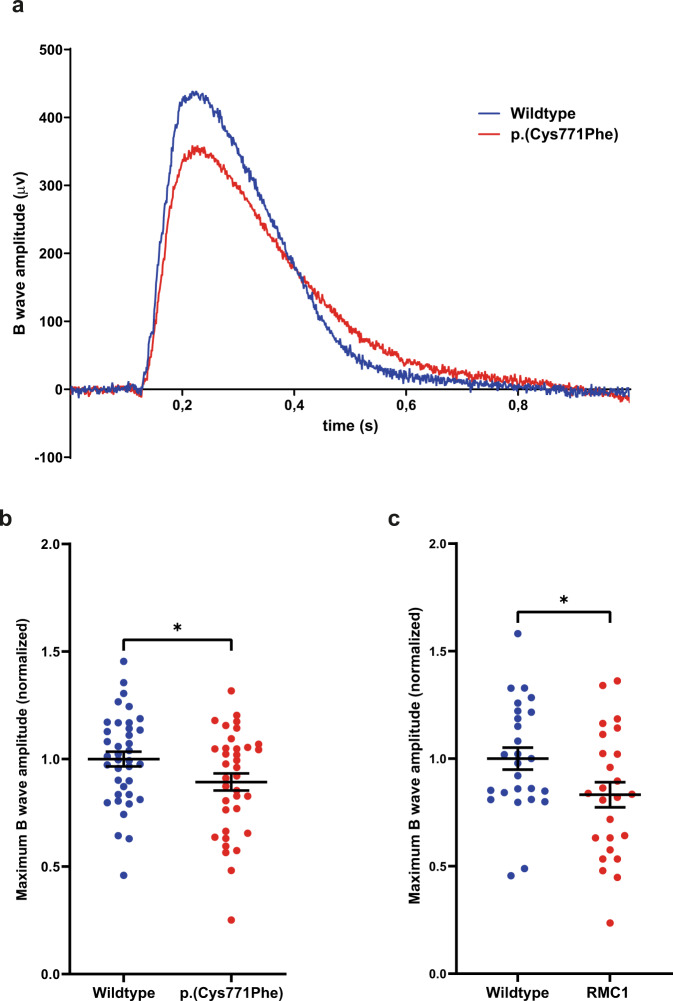
Fig. 5
a Representative electroretinograms of a p.(Cys771Phe) zebrafish and a wildtype sibling at 5 days post-fertilization. b The maximum B wave amplitude was significantly lower in p.(Cys771Phe) zebrafish as compared to wildtype siblings (unpaired t test). The average wildtype amplitude was normalized to 1. Each datapoint corresponds to recordings from an individual larvae (mean?�?SEM). *p: 0.0445. c A comparative analysis of ush2armc1 knock-out larvae and age- and strain-matched wildtype larvae was shown to result in a similar and significant decrease in maximum B wave amplitude. Again, the average wildtype amplitude was normalized to 1. Each datapoint corresponds to recordings from an individual larvae (unpaired t test, mean?�?SEM). *p: 0.0345.