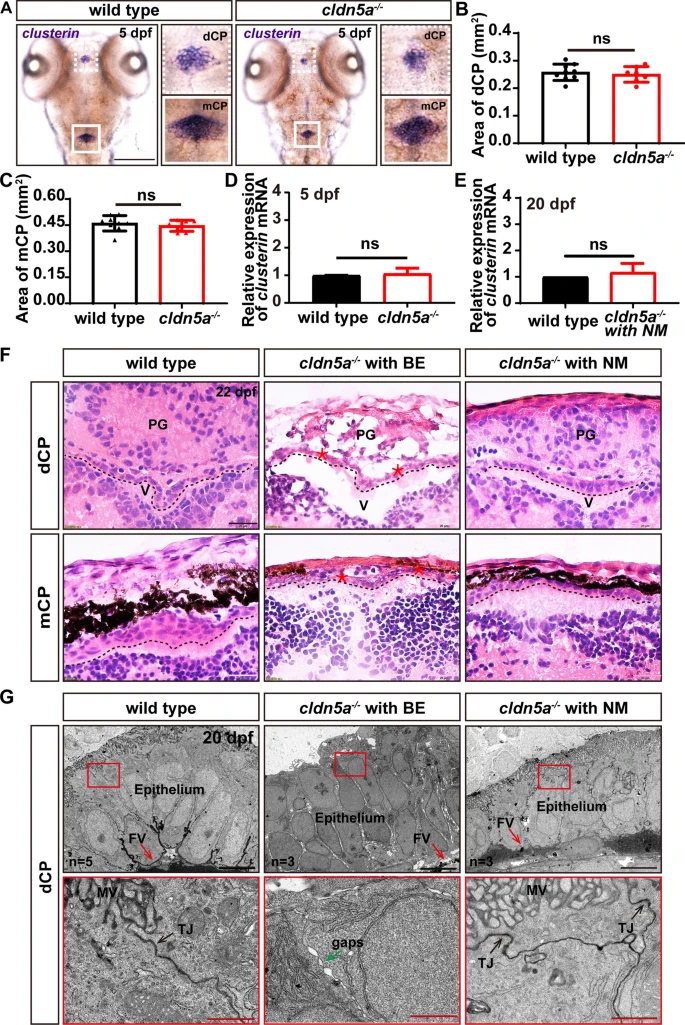
Fig. 8
Development and morphology of CPs in cldn5a-/-. A WISH of clusterin reflects normal morphology of CPs in 5 dpf larvae of cldn5a-/-. White dash line squares and solid squares indicate the regions of dCPs and mCPs which are shown in high magnification in the right panels respectively. Scale bars: 200 ?m. B, C The area of dCPs and mCPs were quantified and no difference between wild types and cldn5a-/- embryos was detected. D, E The expression levels of clusterin mRNA in 5 dpf embryos and 20 dpf larvae was analyzed by RT-qPCR and no discrepancy was detected between wild type and cldn5a. Each experiment was repeated more than three times. Data are shown as mean?±?SEM. ns meant no significance. F Histological analysis by HE staining was performed to show the morphology dCPs and mCPs in 22 dpf larvae. In the brains of cldn5a-/- with NM, the morphology of CP epithelium is as normal as in wild types. In cldn5a-/- with BE, the structure of the pineal gland (PG) is disorganized with irregular cell arrangement and severe cell necrosis. The epithelial cells of dCPs and mCPs were necrotic and the plexus epithelial layer is disordered. Meanwhile, the brain ventricles (V) of cldn5a-/- with BE were enlarged dramatically. Black dot lines figure out the linear CP epithelium. The necrotic CP epithelial cells are indicated by red asterisks. n?=?3 fishes analyzed per group. Scale bars: 20 ?m. G Ultrastructural analysis of dCP epithelium of wild types and cldn5a-/- with or without BE at 20 dpf. The morphology of cerebral vascular ECs and the integrity of TJs in cldn5a with NM are normal as in wild types. The morphology of dCP epithelium and paracellular TJs (black arrows) in cldn5a with NM was not altered compared to that in wild types, whereas the microvillus of the dCP epithelial cells disappeared in cldn5a-/- with BE. Moreover, there occured paracellular gaps between dCP epithelial cells (green arrow). The regions labeled by red rectangles show epithelial TJs which are presented in the lower panel with high magnification. MV, microvilli; FV, fenestrated vessel. n?>?3 fishes analyzed per group. ns means no significance. Scale bars: 5 ?m in black and 1 ?m in red

