Fig. 4
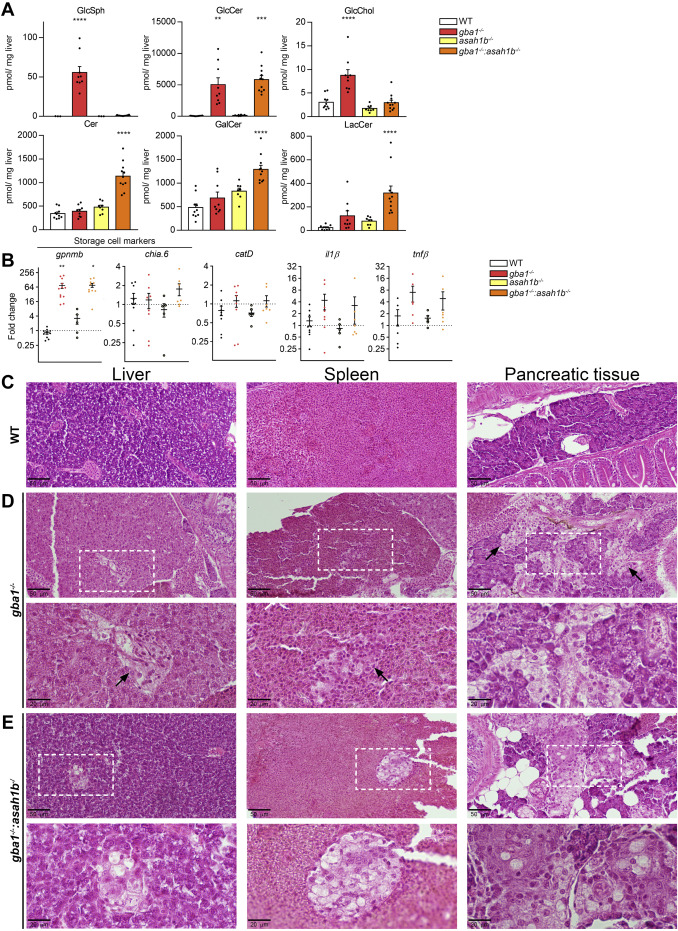
Fig. 4. Abnormalities in adult zebrafish visceral organs. A: Lipid levels were determined in pmol/mg liver tissue. GlcSph, GalCer, and GlcChol were separated from their respective galactosylated lipid by HILIC chromatography. Data is depicted as mean ± SEM; WT (n = 10), gba1-/- (n = 9), asah1b-/- (n = 8), and gba1-/-:asah1b-/- (n = 11). Data is analyzed by One-Way Anova with Tukey?s multiple comparison test. B: Expression of gpnmb, chia.6, il-1?, tnf?, apoEb, or catD mRNA levels were determined using RT-qPCR analysis; WT (n = 6?9), gba1-/- (n = 6?8), asah1b-/- (n = 5), and gba1-/-:asah1b-/- (n = 7). Data is normalized using two housekeeping genes (ef1? and rpl13) and analyzed by One-Way Anova with Tukey?s multiple comparison test. Statistical analysis is depicted of WT versus gba1-/-, asah1b-/-, or asah1b-/-:gba1-/-, only when a significant difference is apparent or of gba1-/- versus asah1b:gba1-/- when significant difference is of interest. Ns = not significant, ?p < 0.05,??p < 0.01, ???p < 0.001, and ????p < 0.0001. C?E, Zebrafish were serially sectioned along the sagittal plane and stained using H&E. Images of liver, spleen, and pancreatic tissue of WT (C), gba1-/- (D), and gba1-/-:asah1b-/- (E) zebrafish. Areas of interest are marked by dotted boxes, and higher magnifications of these areas are shown below the respective overview images. Scale bars: 50 ?m and 20 ?m for low and higher magnifications, respectively. GlcSph, glucosylsphingosine; GalCer, galactosylceramide; GlcChol, glucosylated cholesterol.
Image
Figure Caption
Figure Data
Acknowledgments
This image is the copyrighted work of the attributed author or publisher, and
ZFIN has permission only to display this image to its users.
Additional permissions should be obtained from the applicable author or publisher of the image.
Full text @ J. Lipid Res.

