
Image
|
Figure Caption
Figure 3
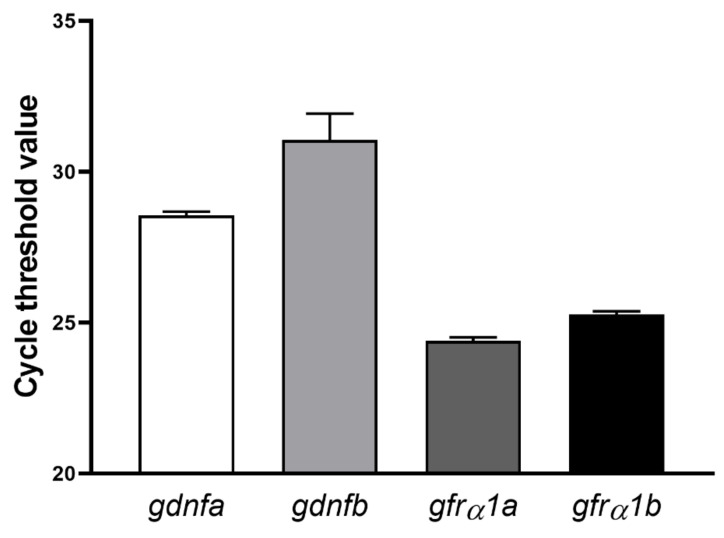
Figure 3. Number of amplification cycles (cycle threshold (Ct)) for both ligands (gdnfa and gdnfb) and receptors (grf?1a and grf?1b) in zebrafish testes. Bars represent the mean � SEM (n = 4) for each transcript.
Figure Data
Acknowledgments
This image is the copyrighted work of the attributed author or publisher, and
ZFIN has permission only to display this image to its users.
Additional permissions should be obtained from the applicable author or publisher of the image.
Full text @ Cells