IMAGE

Figure 4.

ID
ZDB-IMAGE-220404-24
Source
Figures for Wiggin et al., 2022
Image
Figure Caption

Figure 4.

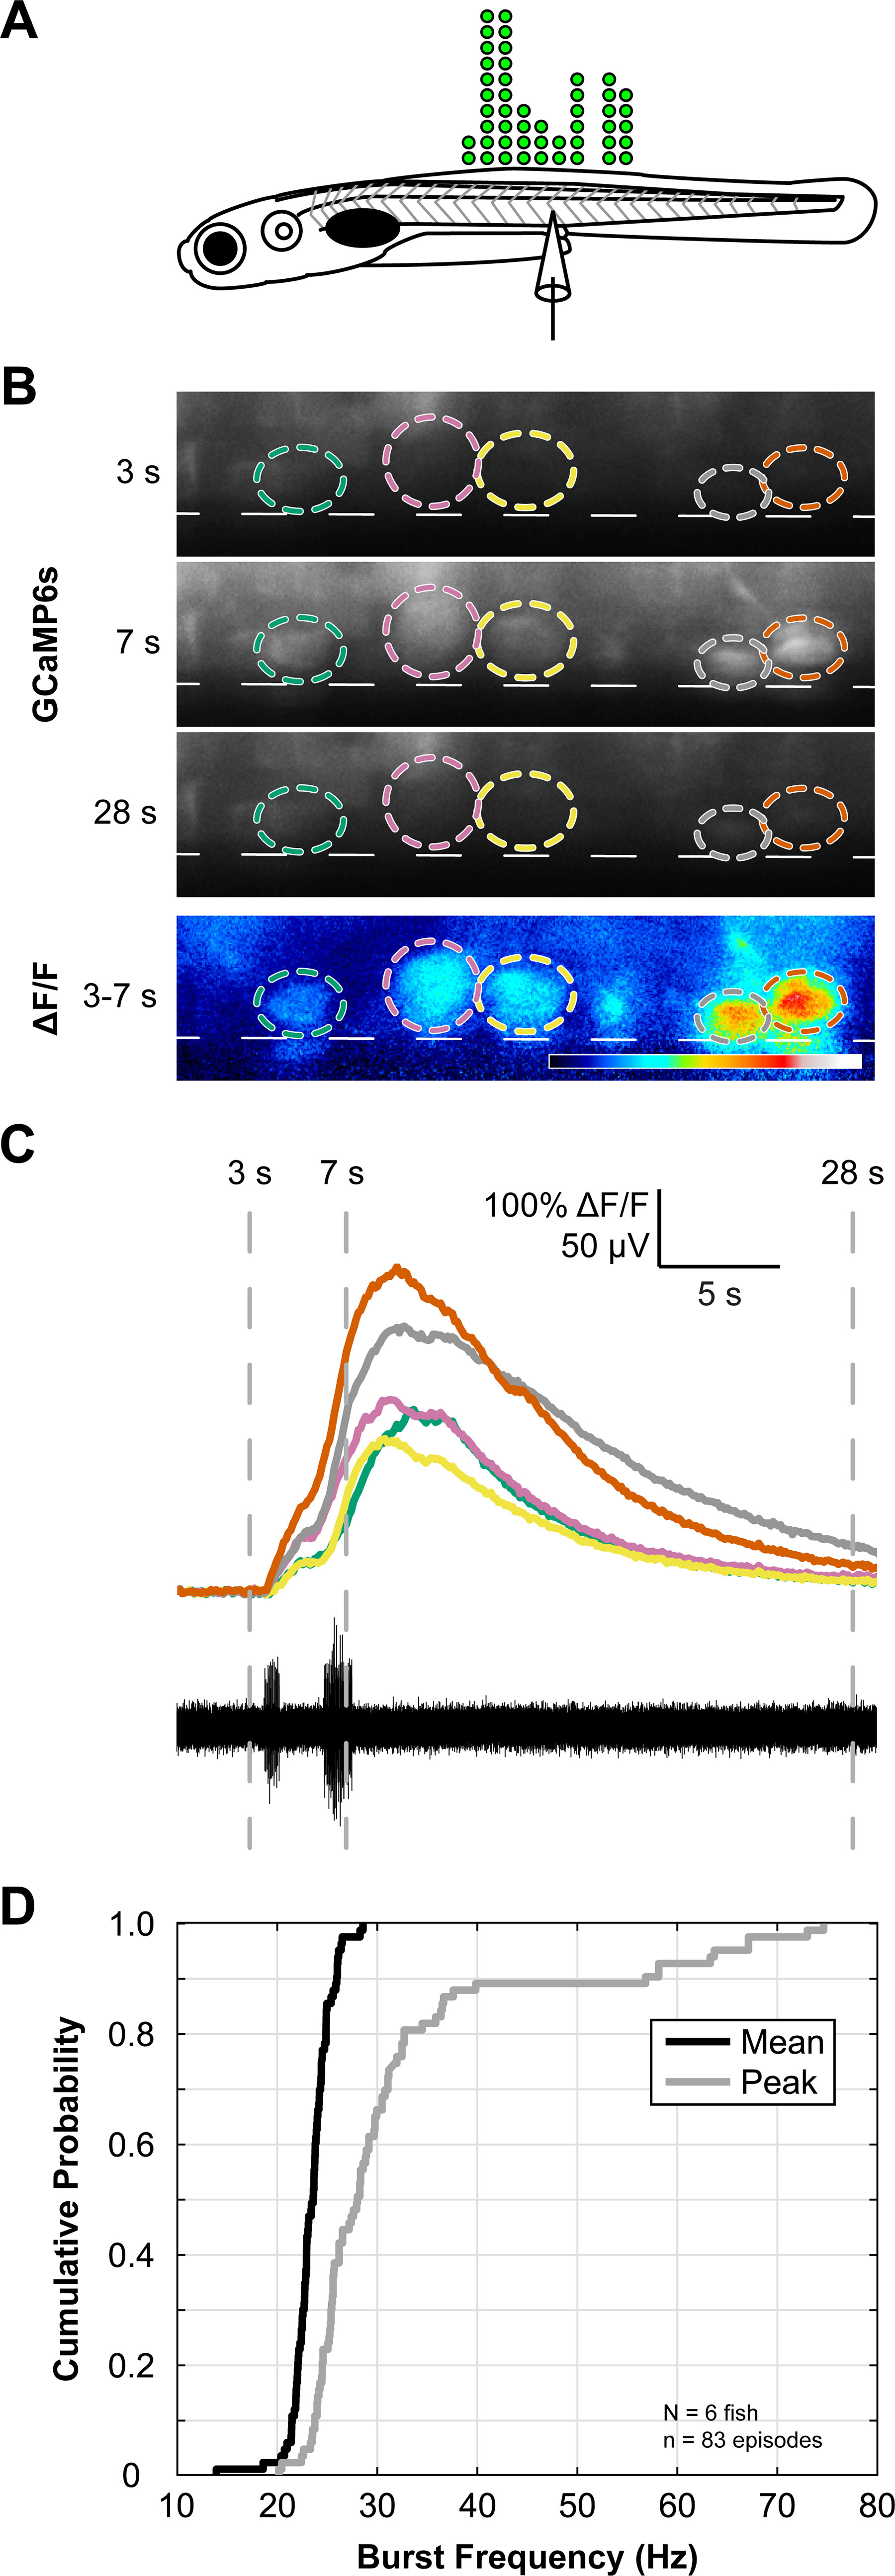
V3-IN activity is temporally correlated to fictive locomotion. A, Schematic representing the number and distribution of V3-INs (green circles) along the rostrocaudal axis of the spinal cord monitored during calcium imaging experiments. B, Each V3-IN in the field of view in Tg(vglut2a:Gal4ff)nns20;Tg(UAS:GCaMP6s)nk13a double transgenic larvae was assigned a ROI during spontaneous fictive swimming. Panels in B show raw GCaMP6s fluorescence (F) and correspond to numbered time points in C. Bottom panel in B shows calculated ΔF/F between 3- and 7-s time points. Dashed lines represent ventral boundary of the spinal cord. C, Synchronized recordings of GCaMP6s fluorescence (top) and fictive swimming (bottom) allowed identification of swimming-related neuronal activity. D, Plots of cumulative probability distributions for Mean (black line) and Peak (gray line) burst frequencies.

Acknowledgments
This image is the copyrighted work of the attributed author or publisher, and ZFIN has permission only to display this image to its users. Additional permissions should be obtained from the applicable author or publisher of the image. Full text @ eNeuro