Figure 1.
Figure 1.
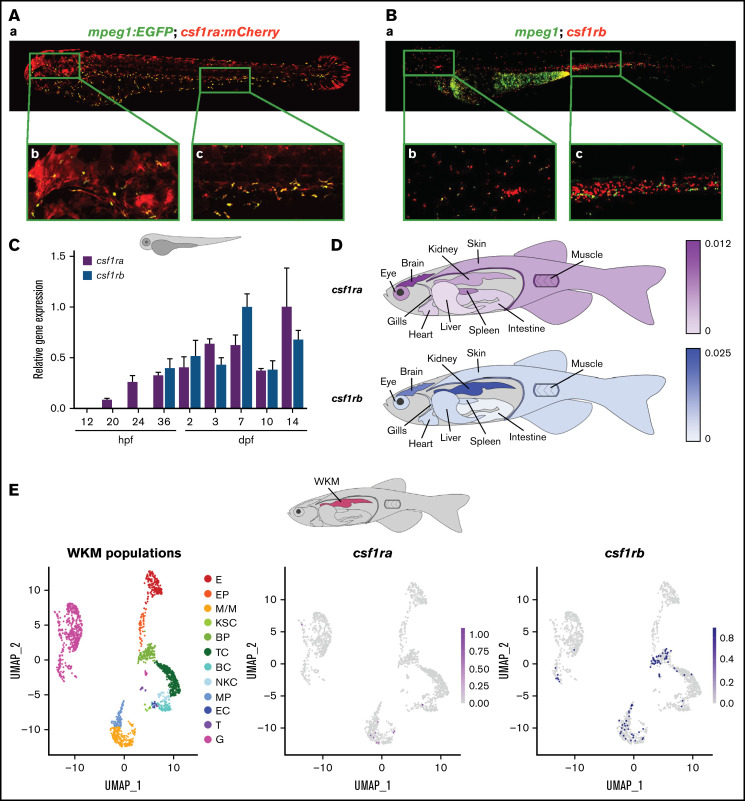
csf1ra and csf1rb have distinct expression patterns in zebrafish. (A) Coexpression of csf1ra (red) and mpeg1 (green) visualized in 72 hpf Tg(fms:GAL4;UAS:mCherry);Tg(mpeg1:EGFP) triple transgenic embryos: (Aa) whole embryo, (Ab) head, (Ac) caudal hematopoietic tissue (CHT) region. (B) HCR WISH of 72 hpf embryos for csf1rb (red) and mpeg1 (green). (Ba) whole embryo, (Bb) head, (Bc) CHT region. Fluorescence images were taken on Dragonfly 503 microscope (Andor) using Zyla-4.2 sCMOS camera with magnification ×10 and processed with the Fusion software, FIJI, and Adobe Photoshop. (C) qRT-PCR analysis of pooled zebrafish embryos showing the expression dynamics of csf1ra and csf1rb in zebrafish development. Pool of 15 to 20 embryos per sample in 2 to 6 biological replicates. The expression was normalized to mob4 gene and to the time point with the highest expression (14 dpf for csf1ra and 7 dpf for csfrb). (D) qRT-PCR analysis of adult zebrafish tissues. Pool of 3 to 5 fish organs per sample in 3 to 5 biological replicates. The expression was normalized to ef1? gene. (E) scRNA-seq data showing the expression of csf1ra and csf1rb in whole kidney marrow (WKM) cell populations (pool of 2 to 3 WKMs per sample). BC, B-cells; BP, blood progenitors; E, erythroid cells; EC, endothelial cells; EP, erythroid progenitors; G, granulocytes; KSC, kidney support cells; M/M, monocytes & macrophages; MP, myeloid progenitors; NKC, NK cells; T, thrombocytes; TC, T-cells.

