Fig 1
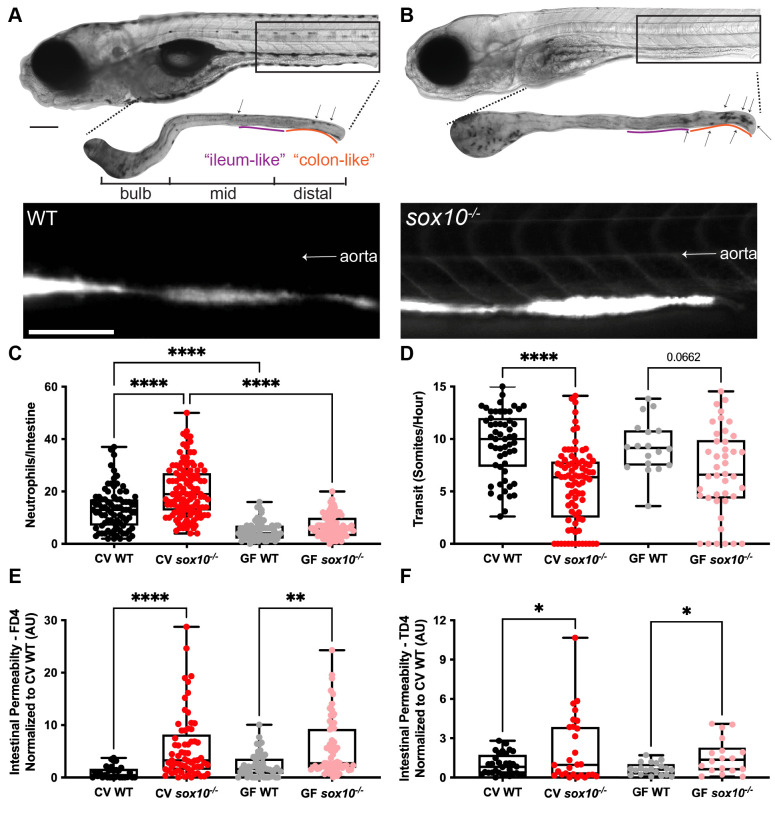
Representative bright field and fluorescence microscopy images showing (A) WT, and (B) sox10-/- larvae (top), dissected intestines stained for myeloperoxidase activity to reveal intestinal neutrophils (middle) and after oral microgavage of 4 kD fluorescein dextran (FD4) (bottom). Arrows indicate intestinal neutrophils. (C) Quantification of intestinal neutrophils per mid and distal intestine in CV and GF larvae. (D) Quantification of intestinal transit of phenol red; distance traveled over time measured as somites/hour (GF WT vs GF sox10-/- t-test p = 0.02). Quantification of (E) FD4 and (F) 4 kD tetramethylrhodamine dextran (TD4) permeability measured as fluorescence intensity in aorta. Scale bars = 300μm. AU = arbitrary units. Each dot in C-F is one fish; n>18 for each condition. Boxes in C-F represent the first to third quartiles, center bar denotes the median, and whiskers the maximum and minimum of each dataset. * p < 0.05, **p<0.01, ****p<00001. A and B: ANOVA followed by Tukey’s post hoc test, C and D: Kolmogorov-Smirnov non-parametric t-test.

