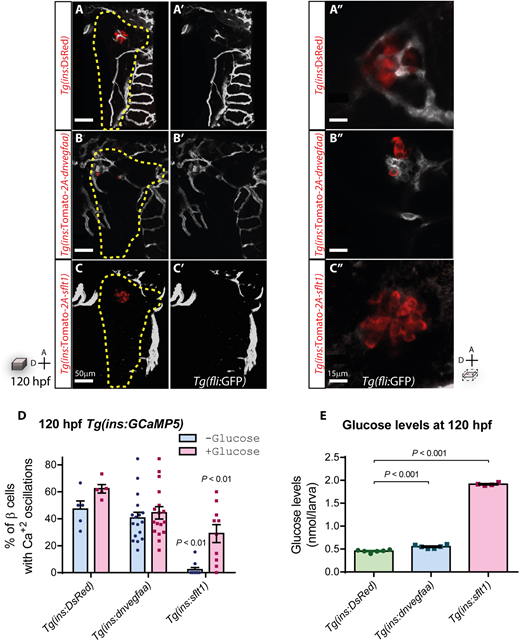
Fig. 3 sFlt1 expression in ?-cells severely impairs their function. (A-C) Confocal projection images of the vasculature (white) in 120?hpf Tg(fli:GFP) larvae, in combination with the indicated transgenic line. Yellow dashed lines outline the pancreas. A?-C? show the endothelial cells. (A?-C?) Confocal planes of ?-cells (red) and the surrounding vasculature (white) in 120?hpf Tg(fli:GFP) larvae, in combination with the indicated transgenic line. (D) Percentage of ?-cells responsive to physiological (?Glucose) and exogenous (+Glucose) glucose, measured as visual fluctuations in fluorescence in 120?hpf Tg(ins:GCaMP5) larvae, n=5-17 animals. (E) Glucose levels in 120?hpf animals, n=4-6 replicates, 10 animals per replicate. Data are meanąs.e.m; individual data points are shown. P-values from t-tests are presented. A, anterior; D, dorsal.
Image
Figure Caption
Acknowledgments
This image is the copyrighted work of the attributed author or publisher, and
ZFIN has permission only to display this image to its users.
Additional permissions should be obtained from the applicable author or publisher of the image.
Full text @ Development

