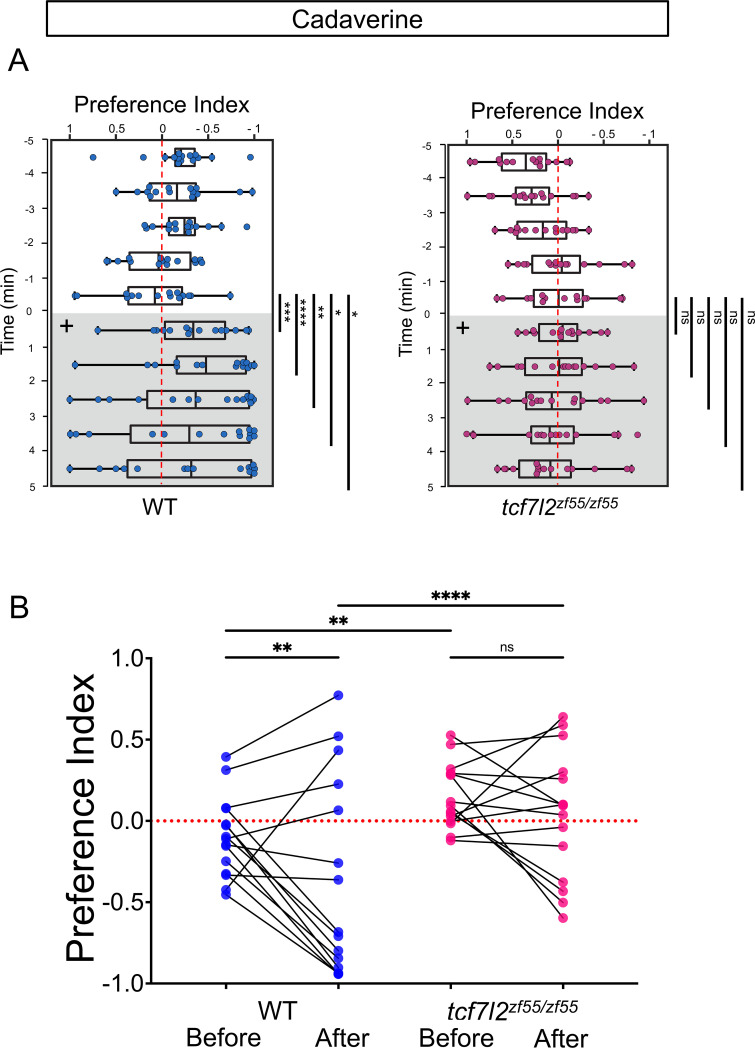
Figure 4—figure supplement 1 Preferred tank location prior to and after cadaverine addition within each group and between groups.
(A) Preference index for tcf7l2 homozygous mutants and their WT siblings after addition of cadaverine (grey and on side indicated by +). Behavior was monitored prior to and after cadaverine addition for 5 min periods. Only WT adults showed a significant difference in their location 5 min afterwards compared to the min before its addition [at 6 min (p = 0.0003), 7 min (p < 0.0001), 8 min (p = 0.0067), 9 min (p = 0.0479) and 10 min (p = 0.0215), Wilcoxon signed-rank test, n = 15 adults for each group]. (B) Preference index before and after addition of cadaverine averaged over 5 min periods for WT [?0.0986 ± 0.0637 and ?0.3574 ± 0.1571] and tcf7l2 adults [0.152 ± 0.0514 and 0.0361 ± 0.1015], n = 15 fish. Two-way ANOVA reveals significant effect of time [F(3, 152) = 34.41, p < 0.0001], group [F(14, 60) = 17.38, p < 0.0001] and interaction [F(42, 180) = 5.786, p < 0.0001]. Post-hoc analysis by Bonferroni?s multiple comparisons. Dashed red lines in A and B denote midpoint of test tank.

